IBIT 70-day bearish forecast — Nov 7, 2026
- Bias: Bearish
- Timeframe: 70 days (made Nov 7, 2026, target date Jan 15, 2027)
- Price at analysis: $42.88
- Price target: $40.50
- Expected range: $36.50 – $45.50
- Result: Pending — graded after the close on Jan 15, 2027
Get a free AI analysis of IBIT today
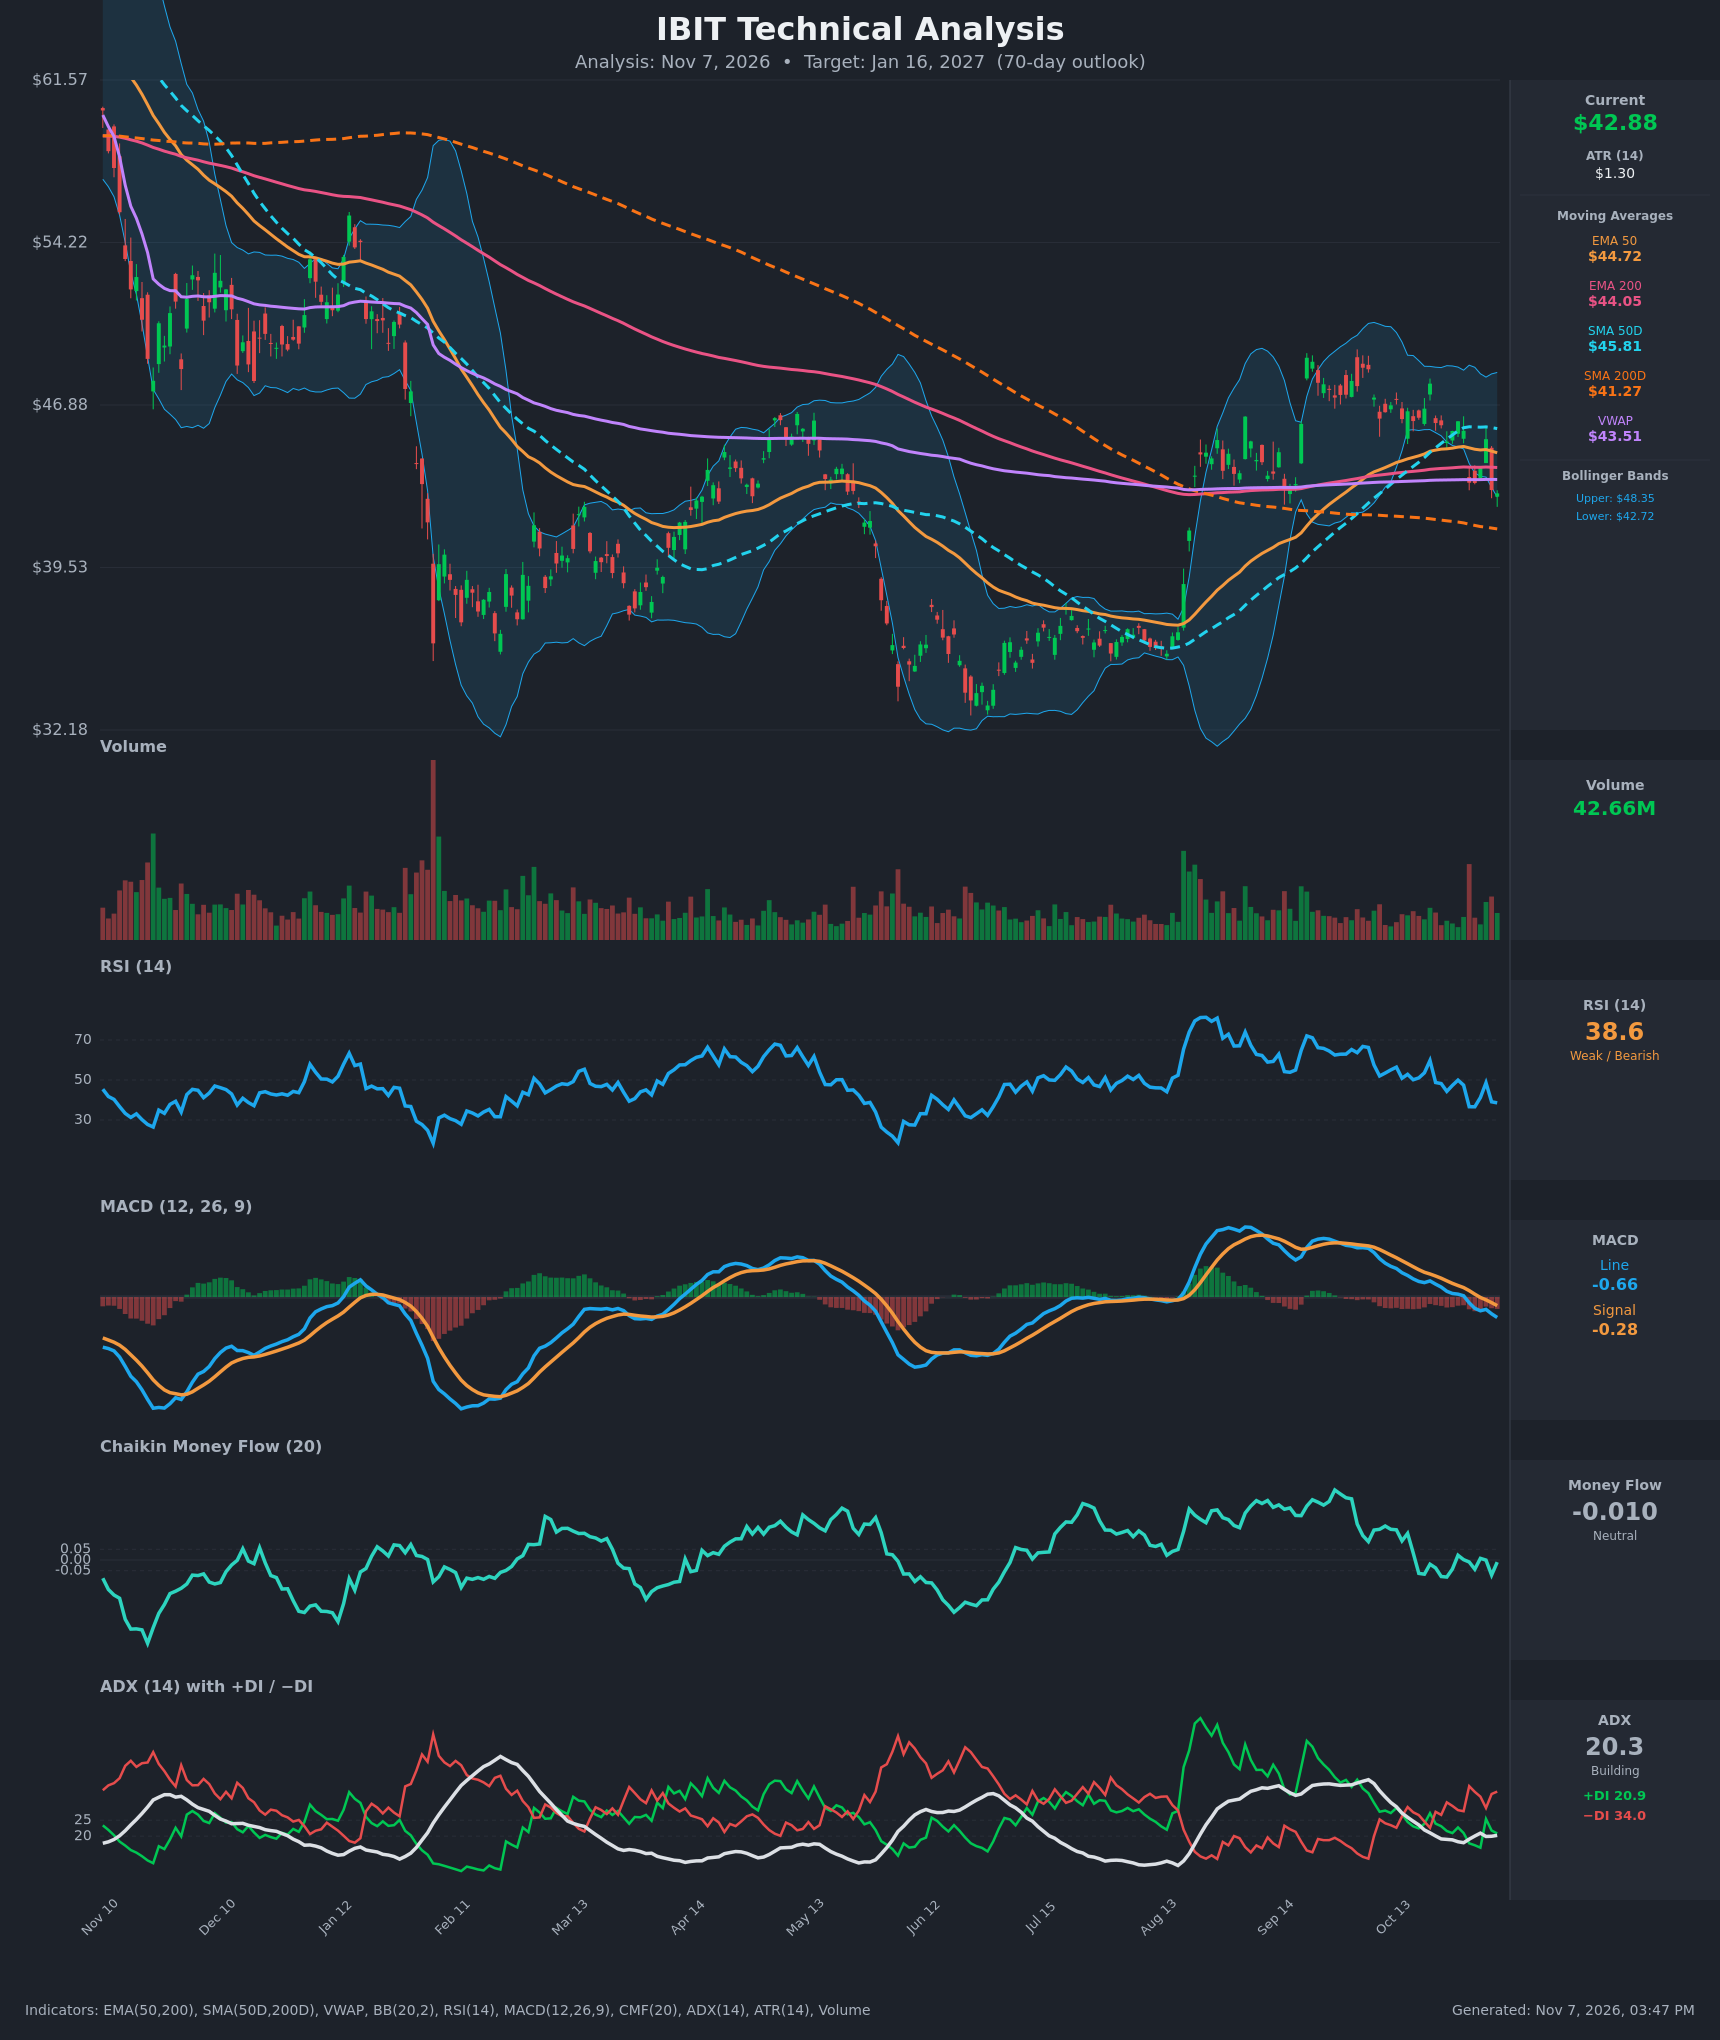
Analysis
TECHNICAL INDICATORS
- RSI (14): 38.57, down from about 50 in late October and now close to the oversold zone. It has set lower highs (59.8 → 49.9 → 48.6) and is turning back down, so momentum is weak but not yet washed out. [Bearish]
- 20 EMA: No 20 EMA value was supplied. The nearest dynamic reference is the EMA 50 at $44.72, which price ($42.88) has fallen below, and it now acts as overhead resistance. The EMA 200 at $44.05 has also been lost. [Bearish]
- MACD: The line (-0.663) is below the signal (-0.279) and below zero. It crossed down on Nov 3 and the gap has widened since, so the histogram is negative and expanding. [Bearish]
- Bollinger Bands (20): Price at $42.88 is hugging the lower band ($42.72), with the upper band at $48.35 and the middle band near $45.5. A band walk is possible, but the lower band also invites a short-term bounce. The bands are fairly wide after the Sep–Oct swing. [Bearish]
- CMF (20): -0.010, inside the ±0.05 neutral zone. It has faded from the sustained accumulation of Aug–Oct, so buying support has dried up without clear distribution yet. [Neutral]
- ADX (14): 20.3 with −DI (34.0) well above +DI (20.9). The trend is weak, but the direction is clearly with the sellers. −DI has led since Oct 22 apart from a brief bounce on Nov 4. [Weak Trend, Bearish Direction]
- Volume: 42.66M, roughly average with no capitulation spike. Selling is orderly rather than panicked, and the bounces on Nov 3–4 came on unremarkable volume. [Neutral to Mildly Bearish]
Moving-average structure:
- Price is below VWAP ($43.51), EMA 50, EMA 200 and SMA 50D ($45.81).
- Price is still above SMA 200D ($41.27), the key long-term support.
- SMA 50D is above SMA 200D, so there is no death cross yet.
- EMA 50 ($44.72) sits only slightly above EMA 200 ($44.05), and the gap is narrowing. A bearish EMA cross is possible in coming weeks.
DIVERGENCES & TRENDS
- There is no clear bullish divergence. RSI and MACD are confirming the price decline rather than diverging from it.
- Price peaked near $49 in September, then made lower highs at $47.84 (Oct 21) and $45.33 (Nov 4). RSI and MACD peaks fell in step, which is a bearish trend confirmation.
- The MACD bearish crossover (Nov 3) and the −DI dominance since Oct 22 point to a deteriorating short-term trend.
- SMA 50D has flattened and is starting to roll over (45.89 → 45.81), a possible early sign of trend exhaustion.
- CMF fell from its September highs to neutral, showing fading demand.
- The price is leaving the Aug–Oct uptrend structure, and the SMA 200D at $41.27 is the next major line in the sand.
CHART PATTERNS
- Bearish Double Top (developing): Peaks at about $49 in September and about $47.8 in late October, with a neckline around $42.7–$43.0 (the Nov 5–6 lows). Price is testing that neckline now. A decisive close below it would confirm the pattern. The measured move (about $6 of height) points toward the high $30s, but SMA 200D support at $41.27 and the $39–$40 zone should slow the decline, so I use a partial target.
- Descending Triangle / Bearish Flag tendencies: Lower highs against a flat support band near $43 resemble a descending triangle. A break below favors continuation lower.
- Failure scenario: If price reclaims $44.7–$45.8 (EMA 50 and SMA 50D) with volume, the double-top reading is invalidated and a range or recovery toward $47–$48 becomes likely.
POTENTIAL SCENARIOS
- Scenario 1: Bearish Neckline Break and Retest of the 200D — Price loses the $42.7–$43.0 neckline and lower Bollinger Band support and drifts down toward the SMA 200D. Weak rallies fail at VWAP and the EMAs. Trigger: daily close below $42.50 with MACD still falling. Target: $40.50, with an extension to $38.50–$39.50. Invalidation: daily close above $45.80 (SMA 50D). (50% probability)
- Scenario 2: Neutral Range and Base Above the 200D — Price holds above the SMA 200D and chops between about $41 and $45.5. RSI is near oversold and the lower band offers a bounce, with ADX staying near 20. Trigger: bounce off $41.3–$42.7 with a RSI turn higher. Target: $43.50–$45.00. Invalidation: close below $40.50 or above $46. (25% probability)
- Scenario 3: Bullish Reclaim and Recovery — A rebound from oversold RSI and lower-band support lifts price back through VWAP, EMA 50 and SMA 50D, which would negate the double top. Trigger: close above $45.80 with MACD turning up and CMF above +0.05. Target: $47.50–$48.50. Invalidation: close below $41.27. (25% probability)
PRICE TARGETS
- Target Price: $40.50 (70-day horizon)
- Expected Range: $36.50 to $45.50. The width is $9.00, or about 21% of the current price, which fits the 61–180 day guidance.
- Key Levels: Support at $41.27 (SMA 200D, then $39.50), Resistance at $43.51 (VWAP, then $44.72 EMA 50 and $45.81 SMA 50D)
OVERALL BIAS
OVERALL BIAS: BEARISH - Price is below VWAP, EMA 50, EMA 200 and SMA 50D. MACD has crossed down, −DI (34.0) dominates +DI (20.9), RSI is falling, and a double-top neckline is being tested. Support at the $41.27 SMA 200D limits the downside, so the target is a measured move to $40.50.
This is educational analysis and not financial advice.