SPY 7-day bearish forecast — Nov 7, 2026
- Bias: Bearish
- Timeframe: 7 days (made Nov 7, 2026, target date Nov 13, 2026)
- Price at analysis: $735.34
- Price target: $728.00
- Expected range: $712.00 – $754.00
- Result: Incorrect (+1.9%) — closed at $749.48 on Nov 13, 2026; quality score 48/100
Get a free AI analysis of SPY today
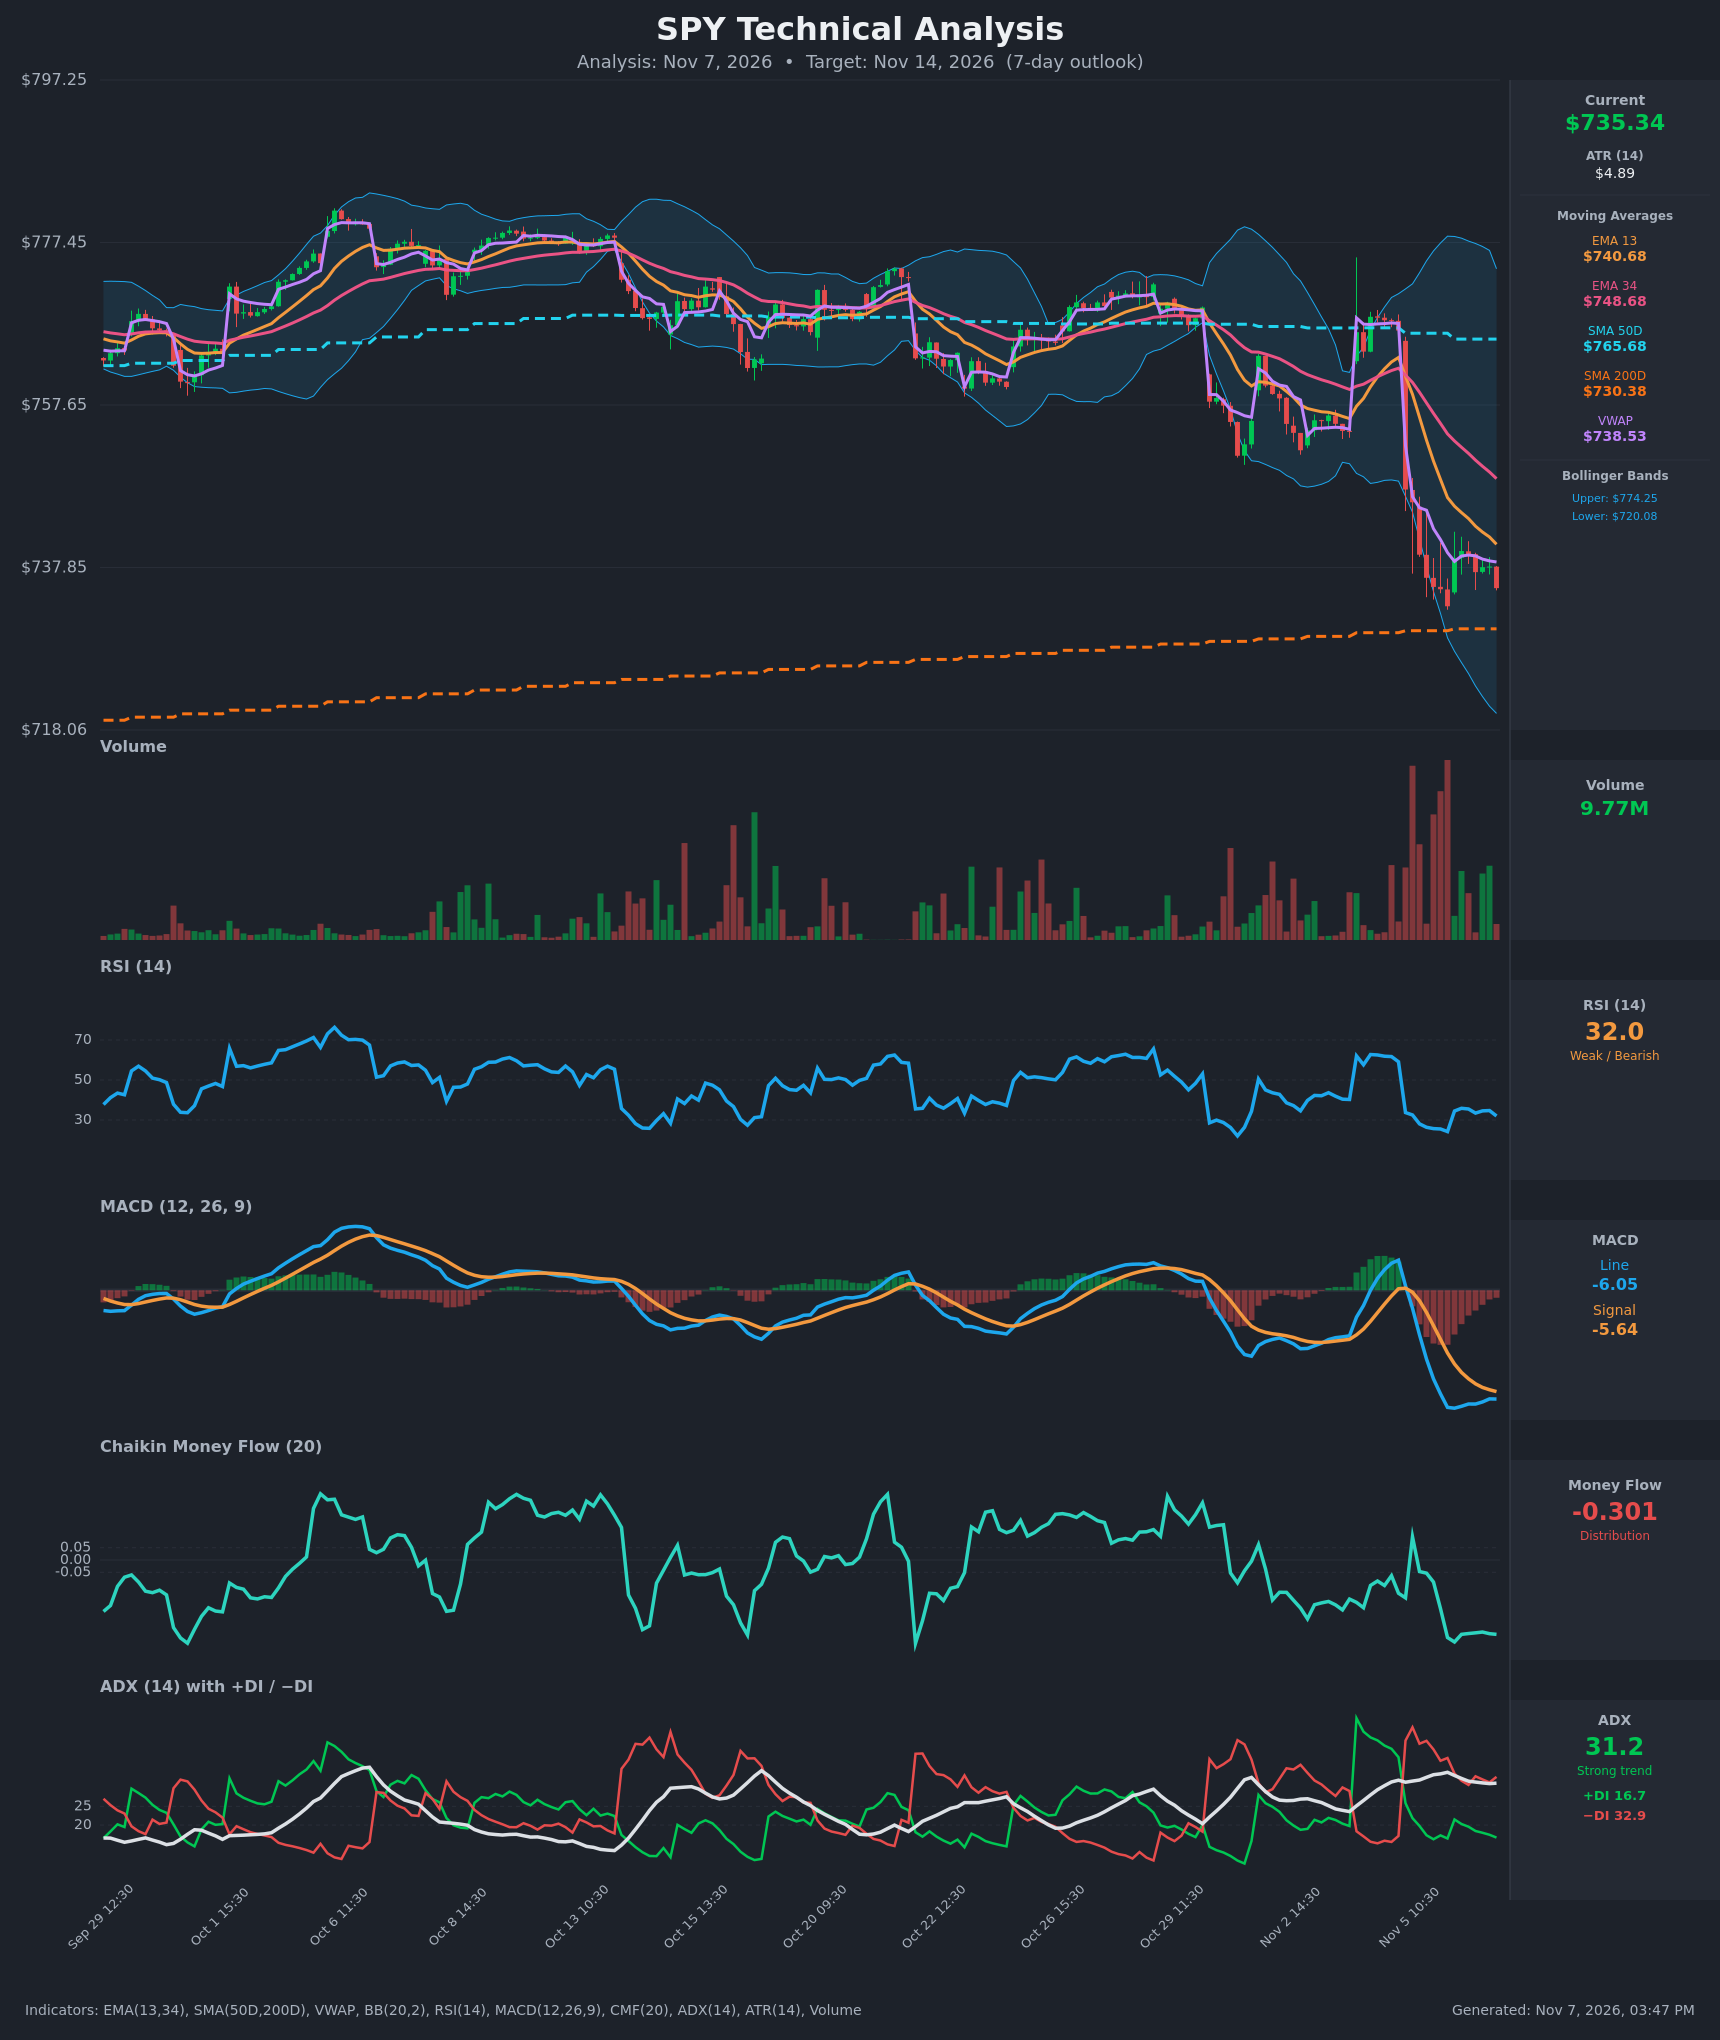
Analysis
TECHNICAL INDICATORS
- RSI (14): 32.0, just above oversold (<30) after bottoming at 24.2 on Nov 5. It has bounced into the mid-30s and rolled back down from 34.7 to 32.0. There is no bullish momentum shift yet. [Bearish]
- 20 EMA (EMA 13 / EMA 34 used): Price of $735.34 is below EMA 13 ($740.68) and EMA 34 ($748.68). EMA 13 crossed below EMA 34 on Nov 5 and the gap is widening, so both averages act as overhead resistance. [Bearish]
- MACD: Line -6.05 is below signal -5.64, a bearish crossover since Nov 5 at 10:30. The histogram is about -0.41, narrower than the -1.1 seen midday Nov 6. The downside impulse is slowing, but the line is still deeply negative with no bullish cross. [Bearish]
- Bollinger Bands (20): Bands run $720.08 to $774.25, and price sits in the lower third, well below the midline (about $747). The bands are very wide after the Nov 5 breakdown, so volatility is elevated. Price has not hugged the lower band, which leaves room for a test of $720. [Bearish]
- CMF (20): -0.301 is far below -0.05, which is heavy distribution. It has stayed deeply negative (-0.29 to -0.33) for the last 8 bars with no sign of recovery. [Distribution]
- ADX (14): 31.2 with −DI 32.9 above +DI 16.7. This is a strong, established downtrend with sellers clearly in control. ADX has eased slightly from 34.1, so the trend is maturing, not accelerating. [Strong Trend – Bearish]
- Volume: 9.77M on the latest bar, well below the heavy red spikes during the Nov 4–5 selloff. The heavy selling came on the breakdown, and the recent bounce attempts have had little follow-through volume. This is typical of a pause or flag after a sharp drop, not accumulation. [Bearish continuation / pause]
Other moving averages and levels:
- VWAP ($738.53): Price is below it, which is mild selling pressure and short-term resistance.
- SMA 50D ($765.68): Price is far below it.
- SMA 200D ($730.38): Price is about 0.7% above it. This is the key long-term support and the main obstacle to further downside.
- SMA 50D vs SMA 200D: SMA 50D is still above SMA 200D, so there is no death cross. The gap is large, but it is narrowing as price falls.
DIVERGENCES & TRENDS
- No bullish divergence yet. Price made a low of $733.13 on Nov 5 with RSI at 24.2. The current price of $735.34 is slightly higher, with RSI at 32.0 and higher, so RSI and price are in line.
- MACD histogram: It is narrowing (-1.13 down to -0.41 over Nov 6), a sign of decelerating downside momentum. It will need a bullish cross to matter.
- Bearish crossovers: EMA 13 crossed below EMA 34 and MACD crossed below signal on Nov 5. −DI crossed above +DI the same day and has stayed on top.
- Trend structure: Price made lower highs from the Nov 4 spike (about $767) and then broke sharply lower. Since then it has made a series of lower highs (about $740 on Nov 6) against flat-to-lower lows.
- Money flow: CMF has fallen steadily from positive readings in mid-October to -0.30, so selling pressure has been persistent.
CHART PATTERNS
- Bearish Pennant / Flag (continuation): After the sharp drop from about $766 to $733, Nov 6 consolidated in a tight $735–$740 range with slightly lower highs. This resembles the Bearish Pennant/Flag in the reference diagram. A break below about $735 projects a measured move toward $720–$725, in line with the lower Bollinger Band.
- Broader context: The earlier range failed at SMA 50D. A series of lower highs and the move below the EMAs resemble a Bearish Rising Wedge / topping structure that has already resolved downward.
- Counterpoint: The SMA 200D at $730.38 sits only about $5 below, which is roughly one ATR. It may cause a pause or a bounce before any further decline.
POTENTIAL SCENARIOS
- Scenario 1: Bearish Pennant Breakdown to the SMA 200D and Lower Band — Sellers stay in control (−DI far above +DI, CMF deeply negative), and price breaks the Nov 6 consolidation low and pushes through the SMA 200D. Trigger: hourly close below $733 and then below $730.38. Target: $722–$725, with the lower Bollinger Band at $720 as a stretch target. Invalidation: close back above $741 (EMA 13/VWAP). (50% probability)
- Scenario 2: Bullish Oversold Relief Bounce — RSI near 30 and support at the SMA 200D trigger a short-covering bounce toward the declining EMAs. Trigger: hold of $730 and reclaim of VWAP ($738.53) with a MACD histogram turn. Target: $745–$749 (EMA 34 area). Invalidation: close below $730. (30% probability)
- Scenario 3: Neutral Range Around the SMA 200D — Price chops between the SMA 200D and the EMA 13/VWAP area as the selloff digests. Trigger: ADX fading below 28 with price oscillating between $729 and $741. Target: $733–$738. Invalidation: decisive break outside $728–$742. (20% probability)
PRICE TARGETS
For the 7-day horizon (to Nov 14, 2026):
- Target Price: $728.00
- Expected Range: $712.00 to $754.00. The width is $42, or 5.7% of the current price, within the 4–8% guidance for 7–10 days.
- Key Levels: Support at $730.38 (SMA 200D, with $720.08 lower Bollinger Band below it), Resistance at $740.68 (EMA 13, with VWAP at $738.53 just below it).
OVERALL BIAS
OVERALL BIAS: BEARISH - Price is below the EMA 13/34, VWAP and SMA 50D, with a bearish MACD cross, strong ADX (31.2) with −DI dominant, and CMF at -0.30 showing heavy distribution. The SMA 200D at $730.38 and RSI near 32 point to a possible bounce, so conviction is moderate.
This is educational analysis and not financial advice.