IBIT 406-day bullish forecast — Nov 7, 2026
- Bias: Bullish
- Timeframe: 406 days (made Nov 7, 2026, target date Dec 17, 2027)
- Price at analysis: $42.88
- Price target: $46.50
- Expected range: $34.00 – $54.00
- Result: Pending — graded after the close on Dec 17, 2027
Get a free AI analysis of IBIT today
Analysis
TECHNICAL INDICATORS
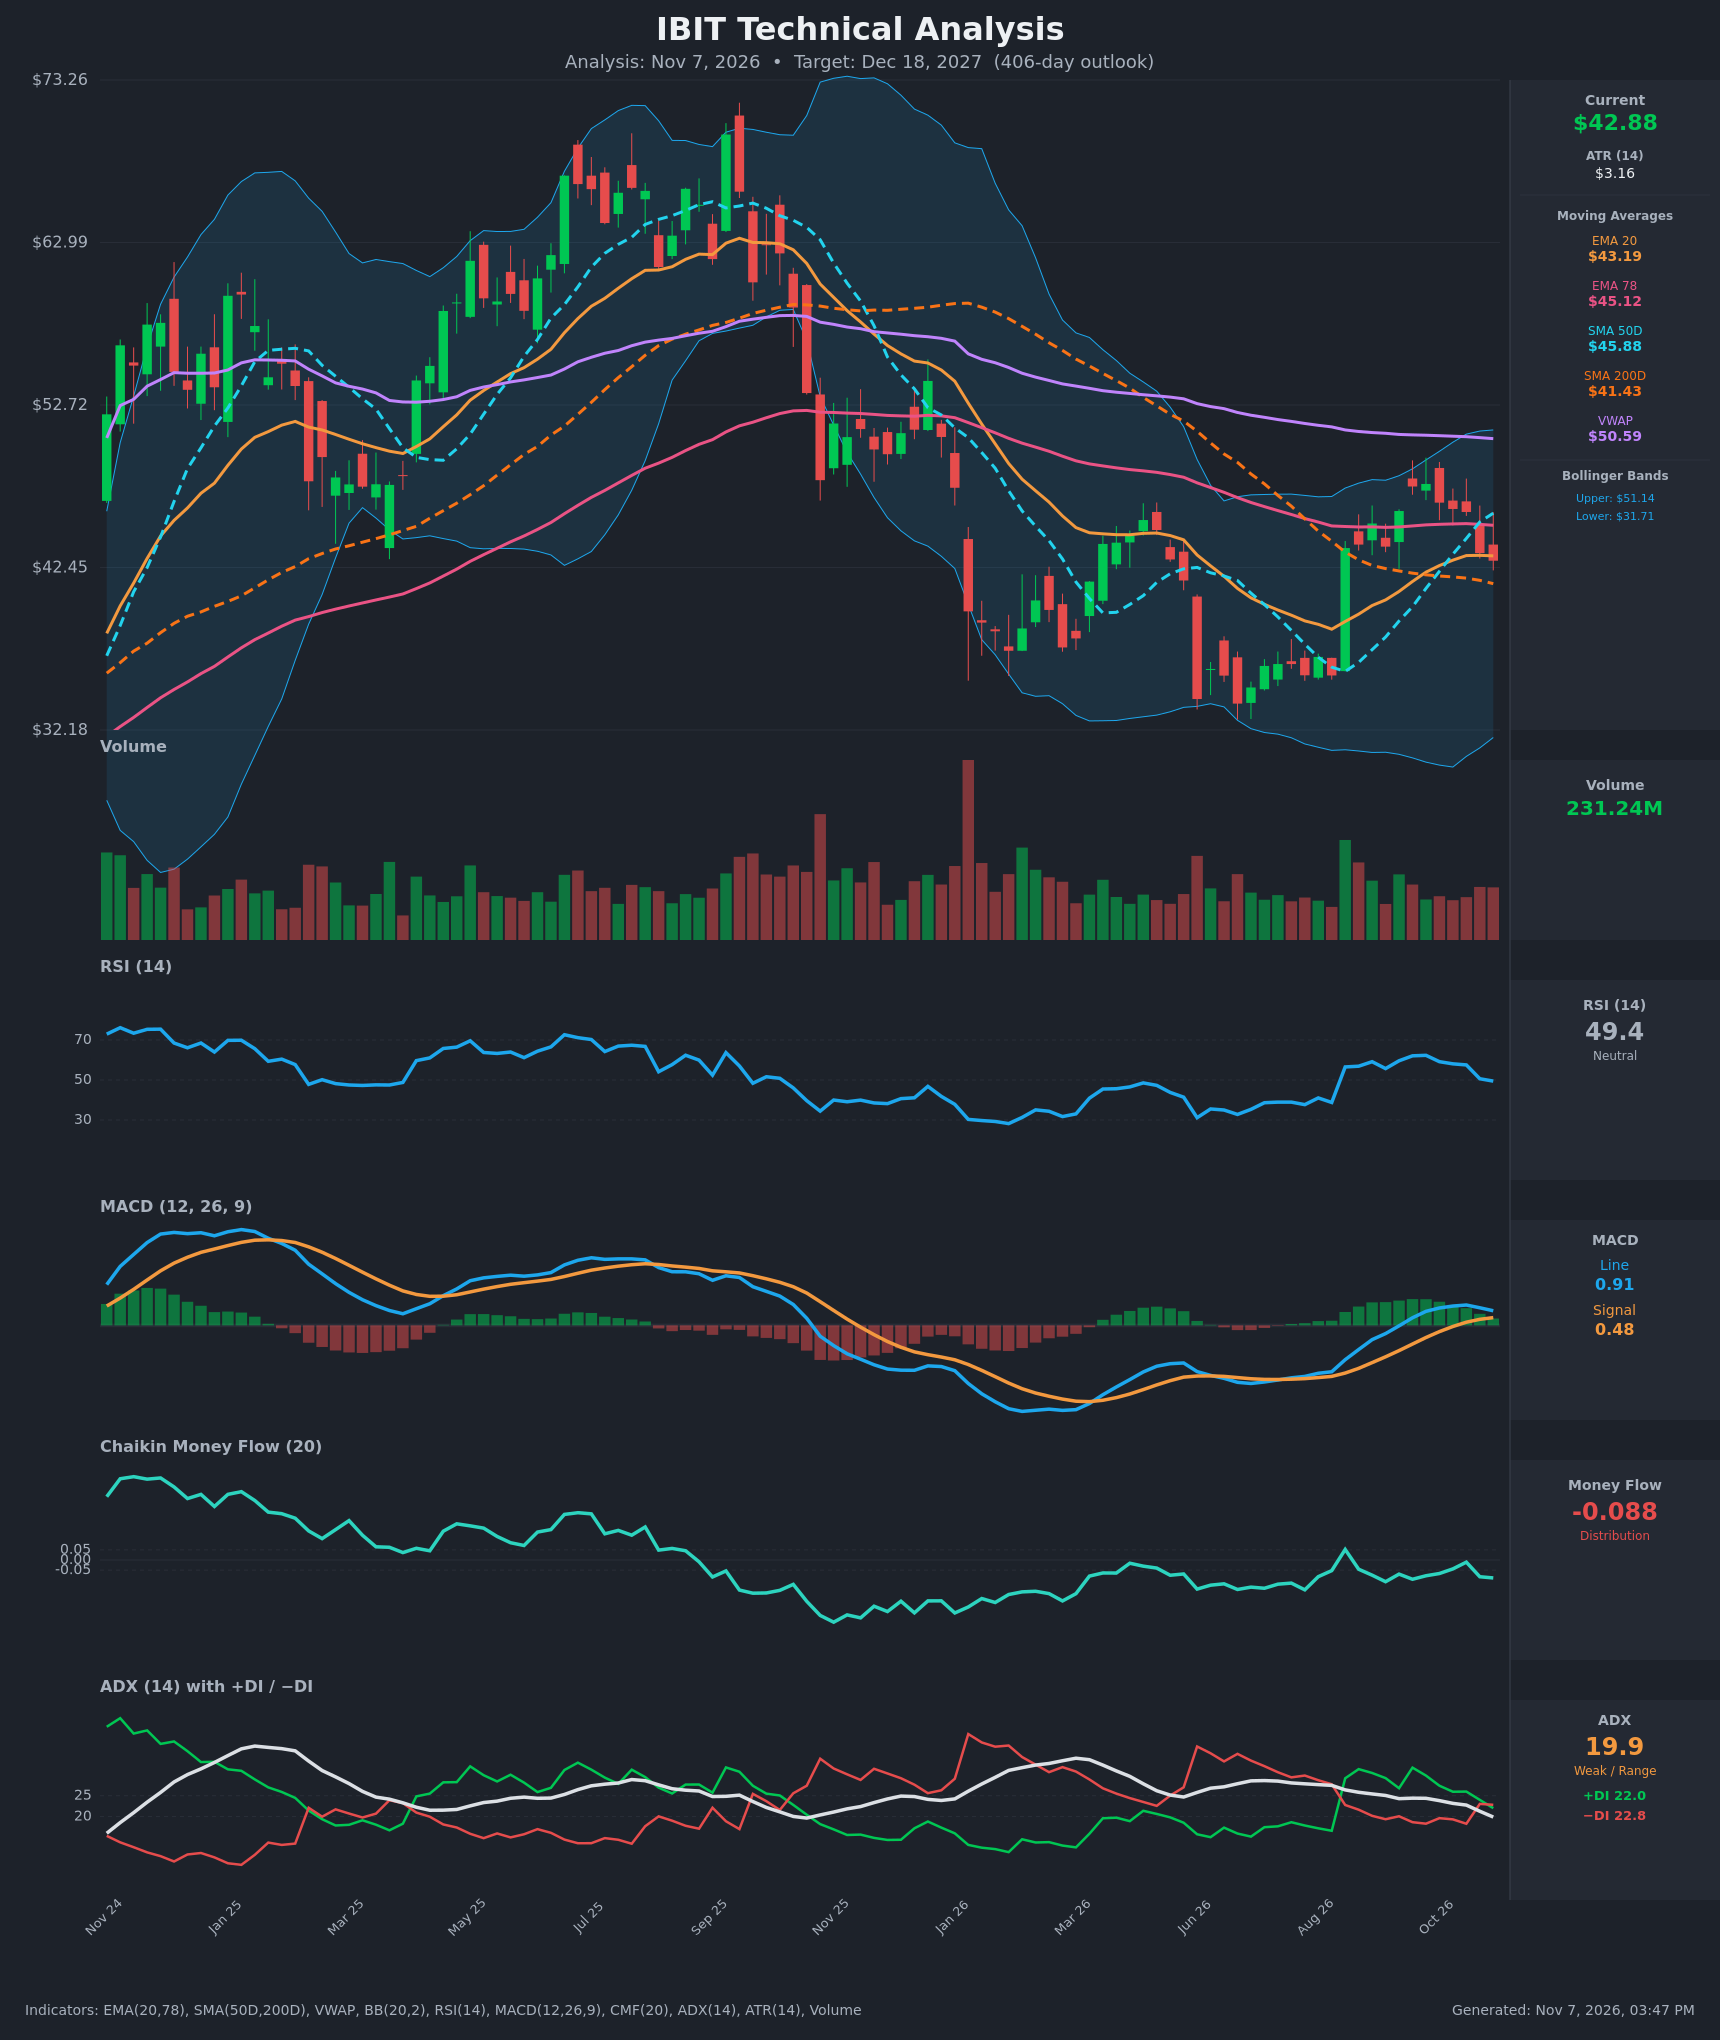
- RSI (14): 49.45, right at the midline. It has fallen from about 62 in September and is rolling over from the 55-60 zone, so momentum is fading, though it is not oversold or overbought. [Neutral]
- 20 EMA: $43.19. Price at $42.88 is just under it, so it now acts as minor resistance. The EMA has flattened after rising for two months. [Neutral]
- MACD: Line 0.906 is above signal 0.482, so it is still bullish, but the histogram has shrunk from its peak (line 1.262 vs signal 0.197 a few bars ago). The line is rolling over and the spread is narrowing, which points to a possible bearish crossover if weakness continues. [Neutral]
- Bollinger Bands (20): Upper $51.14, lower $31.71, midline about $41.4. The bands are very wide after a volatile year. Price is in the middle half of the bands, a little above the midline, after failing near $47-48. This is no squeeze or breakout signal. [Neutral]
- CMF (20): -0.088, below -0.05 and negative for most of the past 12 months. The brief positive reading in August did not hold. Sellers are still more active than buyers on a volume-weighted basis. [Distribution]
- ADX (14): 19.9 and falling from 27.8, so the trend is weak and range-bound. -DI (22.8) has just crossed above +DI (22.0), a marginal bearish tilt with no real conviction. [Weak Trend, slight bearish tilt]
- Volume: 231.24M. Volume is average to slightly below average, with no capitulation or surge. The late-August spike (+22% day) was the main bullish volume event. Recent red candles on modest volume suggest a drift lower, not aggressive selling. [Neutral]
DIVERGENCES & TRENDS
- Moving averages: SMA50 ($45.88) crossed above SMA200 ($41.43) in October 2026, a golden cross, but price has already fallen back below the 50D, EMA78 ($45.12) and VWAP ($50.59). The cross comes from a recovery off the lows, so it is a lagging signal with limited conviction.
- Price vs SMA200: Price is still above the SMA200 ($41.43), the last major long-term support. The SMA200 has turned flat to up after a long decline.
- EMA20 vs EMA78: EMA20 ($43.19) is below EMA78 ($45.12), a bearish alignment. They are converging, not diverging, which fits the range-like structure.
- Mild bearish divergence: Price made a high near $47.7 in late September, and RSI peaked at 62 and MACD kept rising into October. The MACD histogram is now shrinking while price is still elevated, a mild momentum fade.
- Higher lows: The lows rose from about $33.5 (June) to about $35.6 (August), and the late-August breakout was strong. The larger trend since the $73 peak is still a lower-high structure.
- Indicator trends: CMF is stuck below zero, ADX is declining, and the DI lines have converged and crossed. All of this suggests indecision more than trend.
CHART PATTERNS
- Large rectangle / range: Since January 2026, price has been contained roughly between $34 and $48. This resembles the Bearish/Bullish Triple Top/Bottom diagram structures. The lows near $34-36 were tested multiple times and held (a loose bullish triple/double bottom), while the highs near $47-48 capped rallies.
- Post-peak structure: The decline from $73 to $34 is a classic markdown. The recovery looks like a base. A breakout above $48 would complete a double-bottom-type reversal, with a measured move of roughly $14 (range height), pointing to $60-62.
- Bearish risk: If $41.4 (SMA200) and then $36 fail, the range turns into a continuation pattern with a measured target near $28-30.
POTENTIAL SCENARIOS
- Scenario 1: Bullish Range Breakout and Base Completion — The $34-48 base resolves upward, helped by the golden cross and a rising SMA200. Price reclaims the EMA78/SMA50 zone and breaks above $48. Trigger: weekly close above $48 with CMF turning positive above +0.05. Target: $55-60 (measured move of the range). Invalidation: weekly close below $36. (45% probability)
- Scenario 2: Bearish Breakdown to Retest Lows — Price fails at the declining EMA78/SMA50 area, the -DI keeps leading, and CMF stays in distribution. Price loses the SMA200 and then the $36 support. Trigger: close below $41.43, then below $36. Target: $33.50, with an extension to about $28-30. Invalidation: reclaim of $48. (35% probability)
- Scenario 3: Neutral Prolonged Range — Price chops between $36 and $48 for the whole period, consistent with ADX below 20. Trigger: repeated failures at both $48 and $36. Target: $40-46. Invalidation: a decisive close outside $34-$50. (20% probability)
PRICE TARGETS
For the 406-day timeframe (LEAPS category, 35-60% of price), the range is $34.00 to $54.00. Width is $20.00, which is 46.6% of the $42.88 price.
- Target Price: $46.50 (about +8.4%)
- Expected Range: $34.00 to $54.00
- Key Levels: Support at $41.43 (SMA200; deeper support at $34-36), Resistance at $45.88 (SMA50; next resistance $47.70-$48 and the range top)
OVERALL BIAS
OVERALL BIAS: BULLISH - Over a 406-day horizon, the base above $34 (rising lows), the golden cross, price holding above the rising SMA200, and the positive MACD structure favor an upward resolution of the range. Near-term weakness (below EMA20/EMA78, CMF in distribution, ADX under 20) caps conviction, so the upside is modest and the downside risk is significant.
This is educational analysis and not financial advice.