ORCL 6-day bearish forecast — Nov 8, 2026
- Bias: Bearish
- Timeframe: 6 days (made Nov 8, 2026, target date Nov 13, 2026)
- Price at analysis: $116.06
- Price target: $114.00
- Expected range: $108.50 – $119.00
- Result: Incorrect (+6.4%) — closed at $123.52 on Nov 13, 2026; quality score 0/100
Get a free AI analysis of ORCL today
Analysis
TECHNICAL INDICATORS
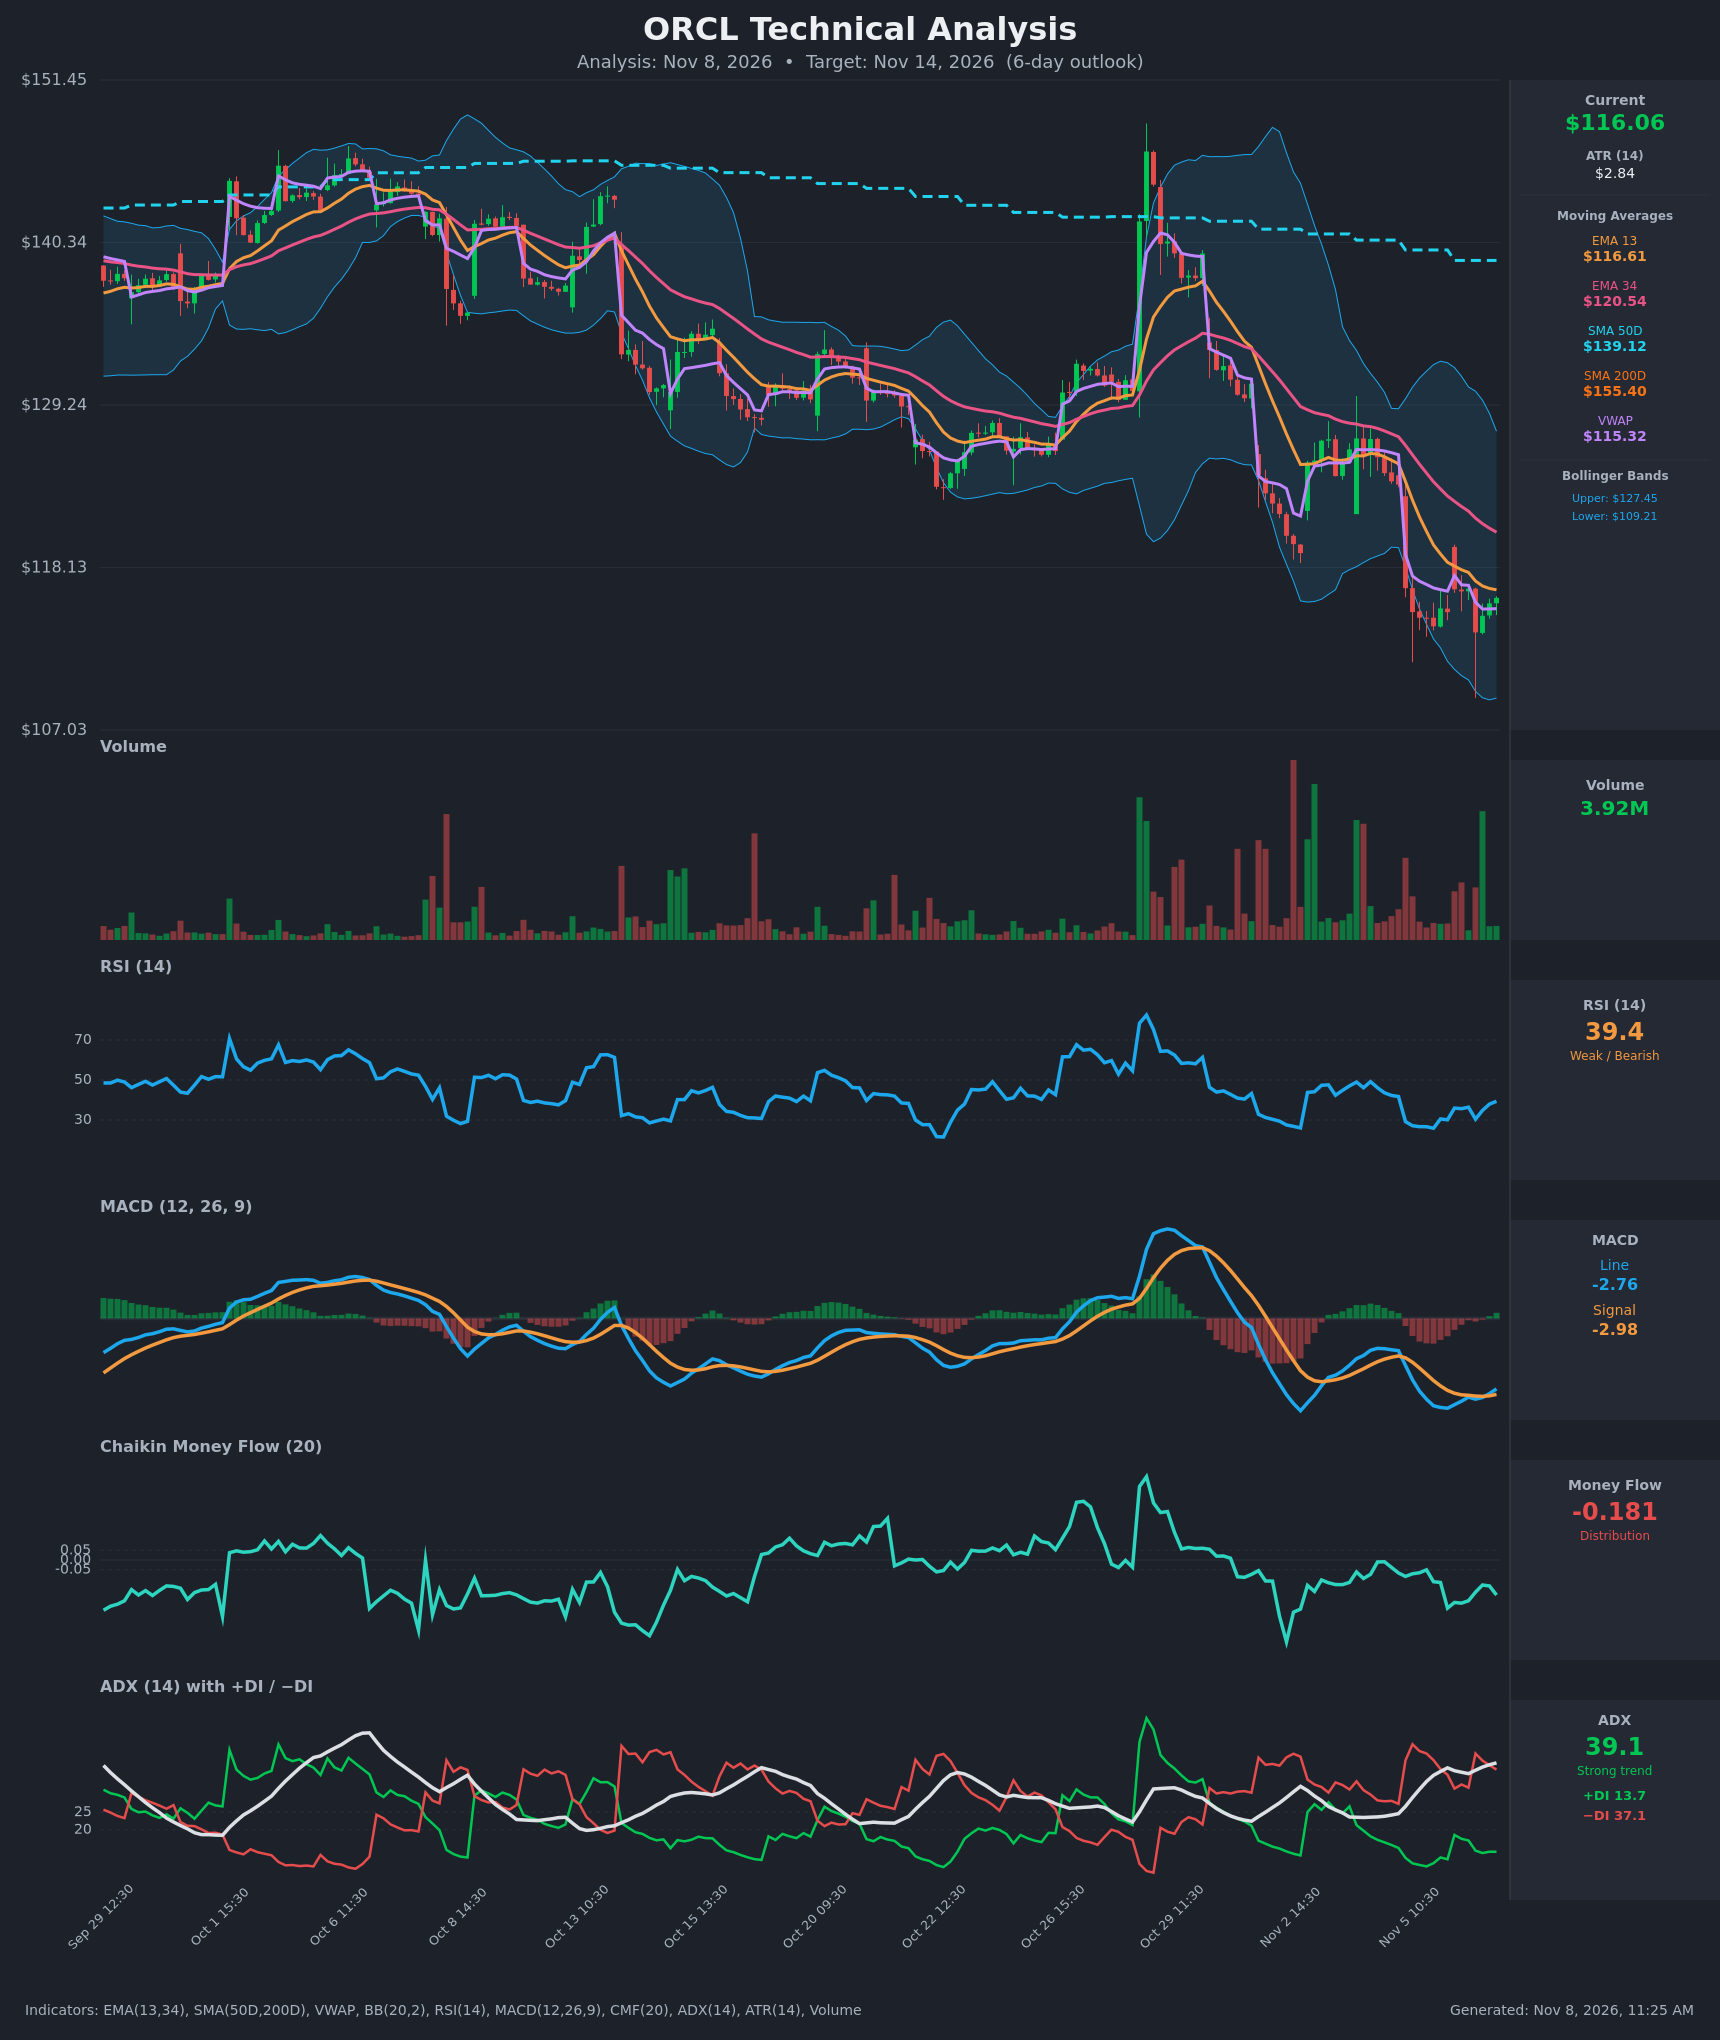
- RSI (14): 39.36, up from the 25.9 low on Nov 5 and rising over the last several bars. It is still below 50 and has not left bearish territory. The bounce is mild and corrective. [Bearish]
- 20 EMA (EMA 13 / EMA 34 used): EMA 13 is $116.61 and EMA 34 is $120.54. Price at $116.06 is just below EMA 13 and well below EMA 34. EMA 13 is under EMA 34, and the gap has narrowed only slightly. Both act as overhead resistance. [Bearish]
- MACD: The line is -2.76 and the signal is -2.98. The line has just crossed above the signal, so the histogram is slightly positive. This is a small bullish momentum cross, but it sits deep below zero and looks like a relief bounce within a downtrend. [Neutral]
- Bollinger Bands (20): Upper is $127.45, lower is $109.21, and the midline is about $118.3. Price is in the lower half of the bands, below the midline, after tagging the lower band near $109–110 in the Nov 5–6 selloff. The bands are wide after the gap down, which means high volatility. [Bearish]
- CMF (20): -0.181, well below -0.05. It has stayed negative for a sustained stretch, which shows persistent distribution. There is no sign yet of accumulation on the bounce. [Distribution]
- ADX (14): 39.1 and rising, with −DI at 37.1 far above +DI at 13.7. This is a strong, established downtrend with bears firmly in control. [Strong Trend – Bearish]
- Volume: 3.92M on the latest bar, which is modest compared with the heavy volume on the Nov 5 breakdown. A small green volume spike appeared on the late bounce. The bounce is on only average volume, so it lacks conviction. [Neutral to Mildly Bearish]
DIVERGENCES & TRENDS
- Price made lower lows into Nov 5–6 while RSI printed 25.9 and then 30.4. The RSI low on Nov 6 is not clearly lower than the earlier low, which is a mild sign of selling exhaustion but not a confirmed bullish divergence.
- MACD crossed up just now, with the line at -2.76 above the signal at -2.98. This is a short-term improvement in momentum while the broader trend remains down.
- Price is below every major moving average: EMA 13, EMA 34, SMA50 ($139.12) and SMA200 ($155.40). SMA50 is far below SMA200, so a death cross is already in place. This is a classic long-term downtrend structure.
- Price is sitting at VWAP ($115.32) and slightly above it. It is holding VWAP for now, which gives short-term support.
- ADX is rising while −DI dominates, so the trend is strengthening rather than fading. CMF has stayed negative with no improvement.
CHART PATTERNS
- Bearish Pennant / Flag (continuation): After the sharp drop from about $123.80 to $114, price has consolidated tightly between about $113.7 and $116.7. This fits a bearish flag or pennant. A downside break targets the measured move of the pole, roughly $10 below the breakdown, which puts $104–106 in play over a longer horizon.
- Bullish Falling Wedge / Double Bottom (reversal): Price tested $113.7–$114.1 several times on Nov 5–6, which could be read as a minor double bottom. It would need a close above about $118–$120 (EMA 34 and the Bollinger midline) to confirm. That has not happened.
- The macro structure of lower highs and lower lows from the $140+ level favors continuation lower.
POTENTIAL SCENARIOS
- Scenario 1: Bearish Flag Breakdown — Price fails at the EMA 13/EMA 34 resistance zone ($116.6–$120.5) and breaks the $113.7 range low as −DI stays dominant. Trigger: close below $113.70 on rising volume. Target: $109.50–$110.50 (lower Bollinger Band). Invalidation: close above $120.50. (50% probability)
- Scenario 2: Neutral Range Chop — Price consolidates between $113.7 and $119 as the MACD cross and oversold bounce offset the persistent selling pressure. Trigger: holds VWAP at about $115.3 with no volume expansion. Target: $114–$118. Invalidation: a break outside $113 or $120. (20% probability)
- Scenario 3: Bullish Relief Bounce — The MACD cross and RSI recovery extend into a mean-reversion bounce toward the Bollinger midline and EMA 34. Trigger: close above $118.30 with improving CMF. Target: $120.50–$122. Invalidation: close back below $114. (30% probability)
PRICE TARGETS
- Target Price: $114.00 (6-day)
- Expected Range: $108.50 to $119.00 (width $10.50, about 9.0% of the current price, in line with the 7–10 day guidance of ~4–8% extended slightly for the high-ATR, strong-trend environment)
- Key Levels: Support at $113.70 (recent range low), Resistance at $120.54 (EMA 34)
OVERALL BIAS
OVERALL BIAS: BEARISH - Price sits below all key moving averages with ADX at 39 and −DI far above +DI. CMF shows persistent distribution, and the small MACD cross and RSI bounce look like a corrective relief rally within a bearish flag.
This is educational analysis and not financial advice.