ORCL 4-day bearish forecast — Nov 8, 2026
- Bias: Bearish
- Timeframe: 4 days (made Nov 8, 2026, target date Nov 11, 2026)
- Price at analysis: $116.06
- Price target: $114.40
- Expected range: $111.50 – $117.50
- Result: Incorrect (+10.6%) — closed at $128.38 on Nov 11, 2026; quality score 0/100
Get a free AI analysis of ORCL today
Analysis
TECHNICAL INDICATORS
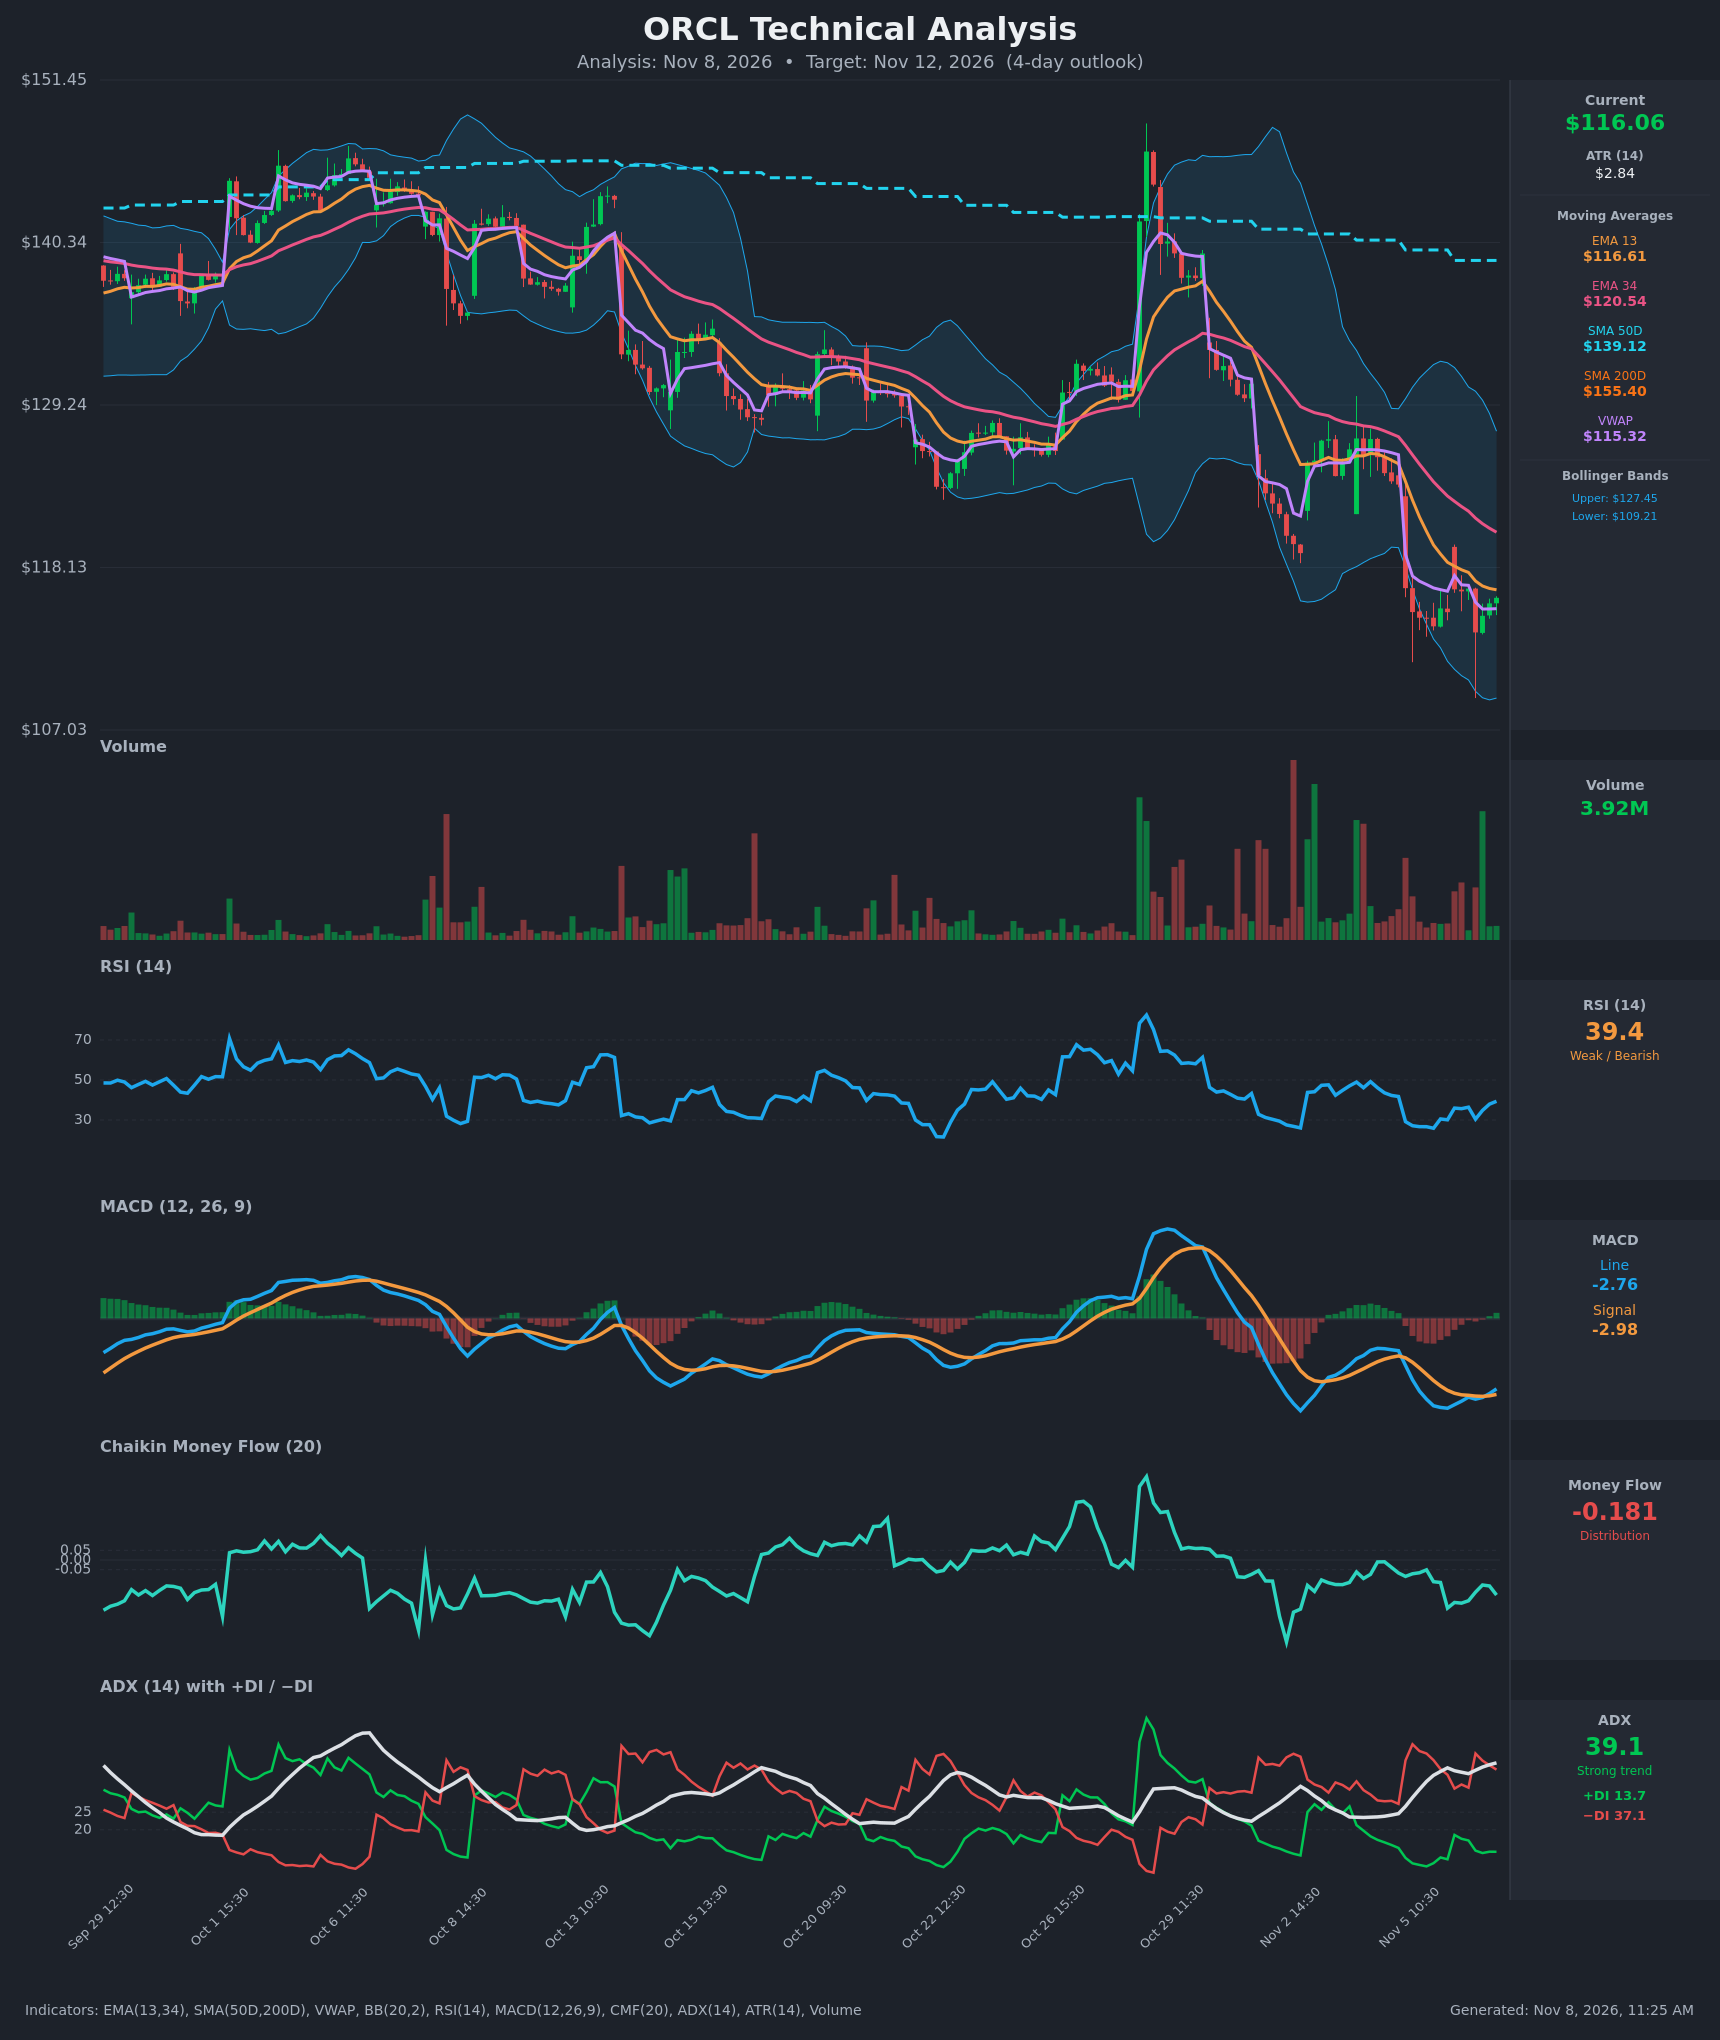
- RSI (14): 39.36, up from the 25.9–26.7 oversold lows on Nov 5. Momentum is recovering, but the reading is still below 40 and below the 50 midline, so the bounce hasn't changed the trend. [Bearish]
- 20 EMA: The supplied EMAs are 13/34. EMA13 is $116.61, just above the $116.06 close, and EMA34 is $120.54, well overhead. EMA13 is below EMA34 and both are falling. EMA13 is acting as immediate resistance, and the Nov 6 rallies stalled at it. [Bearish]
- MACD: Line -2.764 versus signal -2.982, so the line has just crossed above the signal and the histogram is slightly positive (+0.22). The line has risen from -3.53 over the last several bars. Both lines are deep below zero, so this is a relief signal inside a downtrend, not a trend reversal. [Neutral]
- Bollinger Bands (20): Upper $127.45, lower $109.21, midline about $118.33. Price is in the lower half, below the midline, and has already bounced off the lower-band area. The bands are wide after the gap down, which points to elevated volatility. A close back above the midline would be needed to turn this constructive. [Bearish]
- CMF (20): -0.181, well below the -0.05 threshold. It has stayed negative throughout the decline and shows no sign of improving, so sellers are still distributing into the bounce. [Distribution]
- ADX (14): 39.1 and rising, with -DI at 37.1 and +DI at 13.7. Bears are firmly in control of a strong established downtrend. +DI has recovered only slightly from 9.6 and is far below -DI. [Strong Trend – Bearish]
- Volume: 3.92M on the latest bar. The big volume spikes on the chart came on red candles during the breakdown, and the recent basing bars are on lighter volume. The bounce lacks the volume expansion needed to signal real buyer commitment. [Bearish-leaning / No bullish confirmation]
Other levels:
- Price is far below SMA50D ($139.12) and SMA200D ($155.40), and SMA50D is below SMA200D (a death cross), so the long-term trend is bearish.
- Price sits slightly above VWAP ($115.32), a minor positive.
DIVERGENCES & TRENDS
- Bullish divergence: On Nov 6 12:30 price made a marginally lower low ($113.69 vs $114.11), while RSI printed a higher low (30.4 vs 25.9). MACD also made a higher low. This supports a short-term bounce and has not yet broken the downtrend.
- MACD crossover: The line has crossed above the signal. It is a weak signal because both lines are far below zero and still point to a larger downtrend.
- Trend indicators: ADX has climbed from about 25 to 39 in the last few sessions while -DI dominates. This is a classic strong-downtrend reading.
- EMA crossover: EMA13 has been below EMA34 since the Nov 5 gap down, and the gap between them is narrowing slightly (3.9 points, down from 4.4).
- VWAP: Price is hovering around VWAP, which shows equilibrium. Price is not yet clearly above VWAP.
- Money flow: CMF has not confirmed the RSI and MACD bounce, which is a negative for the sustainability of the recovery.
CHART PATTERNS
- Bearish Flag / Pennant (continuation): After the sharp drop from ~$123.80 to ~$114–115, price has consolidated in a tight $113.7–$116.7 range with small, lower-volume candles. This most resembles the Bearish Flag/Pennant from the reference. A break below $113.69 projects a measured move of roughly the prior drop (~$9), toward the $109 lower Bollinger Band area. That full target is probably beyond a 4-day window.
- Bullish Falling Wedge (alternative): The bullish divergences could form a falling wedge or a base near $113–114. It is not confirmed until price closes above ~$117–$118.
- Longer-term: Price is still in a lower-high / lower-low structure under falling SMA50D and SMA200D, which favors the continuation reading.
POTENTIAL SCENARIOS
- Scenario 1: Bearish Flag Breakdown — Price fails at EMA13/VWAP (~$116.6–$117) and rolls over as −DI stays dominant and CMF stays negative. Trigger: close below $113.69 on increased volume. Target: $111.50–$112.50, with an extension toward the lower Bollinger Band at $109.21. Invalidation: close above $118.30 (BB midline). (50% probability)
- Scenario 2: Bullish Relief Bounce — The MACD cross and RSI divergence lead to a short-covering rally toward the EMA34 and the Bollinger midline. Trigger: close above $116.70, then $118.30. Target: $119.50–$120.50 (EMA34 at $120.54). Invalidation: close below $113.69. (32% probability)
- Scenario 3: Neutral Range Chop — Price keeps consolidating between $113.7 and $117 on low volume. Trigger: failure to break either edge. Target: $114.50–$116.50. Invalidation: a decisive close outside the $113.69–$117.00 range. (18% probability)
PRICE TARGETS
Timeframe: 4 days from now (Nov 12, 2026).
- Target Price: $114.40
- Expected Range: $111.50 to $117.50 (width $6.00, about 5.2% of current price, consistent with a ~4-day horizon)
- Key Levels: Support at $113.69, Resistance at $116.70. A break above $116.70 would open $118.30 (BB midline) and then $120.54 (EMA34).
OVERALL BIAS
OVERALL BIAS: BEARISH - ADX at 39 with −DI (37.1) far above +DI (13.7), price below all key moving averages, and persistent distribution (CMF -0.18) outweigh the modest MACD crossover and RSI bounce. The bounce is stalling at EMA13 on light volume, which favors a drift lower or a breakdown of the small flag.
This is educational analysis and not financial advice.