SOFI 4-day bearish forecast — Nov 8, 2026
- Bias: Bearish
- Timeframe: 4 days (made Nov 8, 2026, target date Nov 11, 2026)
- Price at analysis: $16.20
- Price target: $16.00
- Expected range: $15.55 – $16.60
- Result: Correct (-0.3%) — closed at $16.16 on Nov 11, 2026; quality score 100/100
Get a free AI analysis of SOFI today
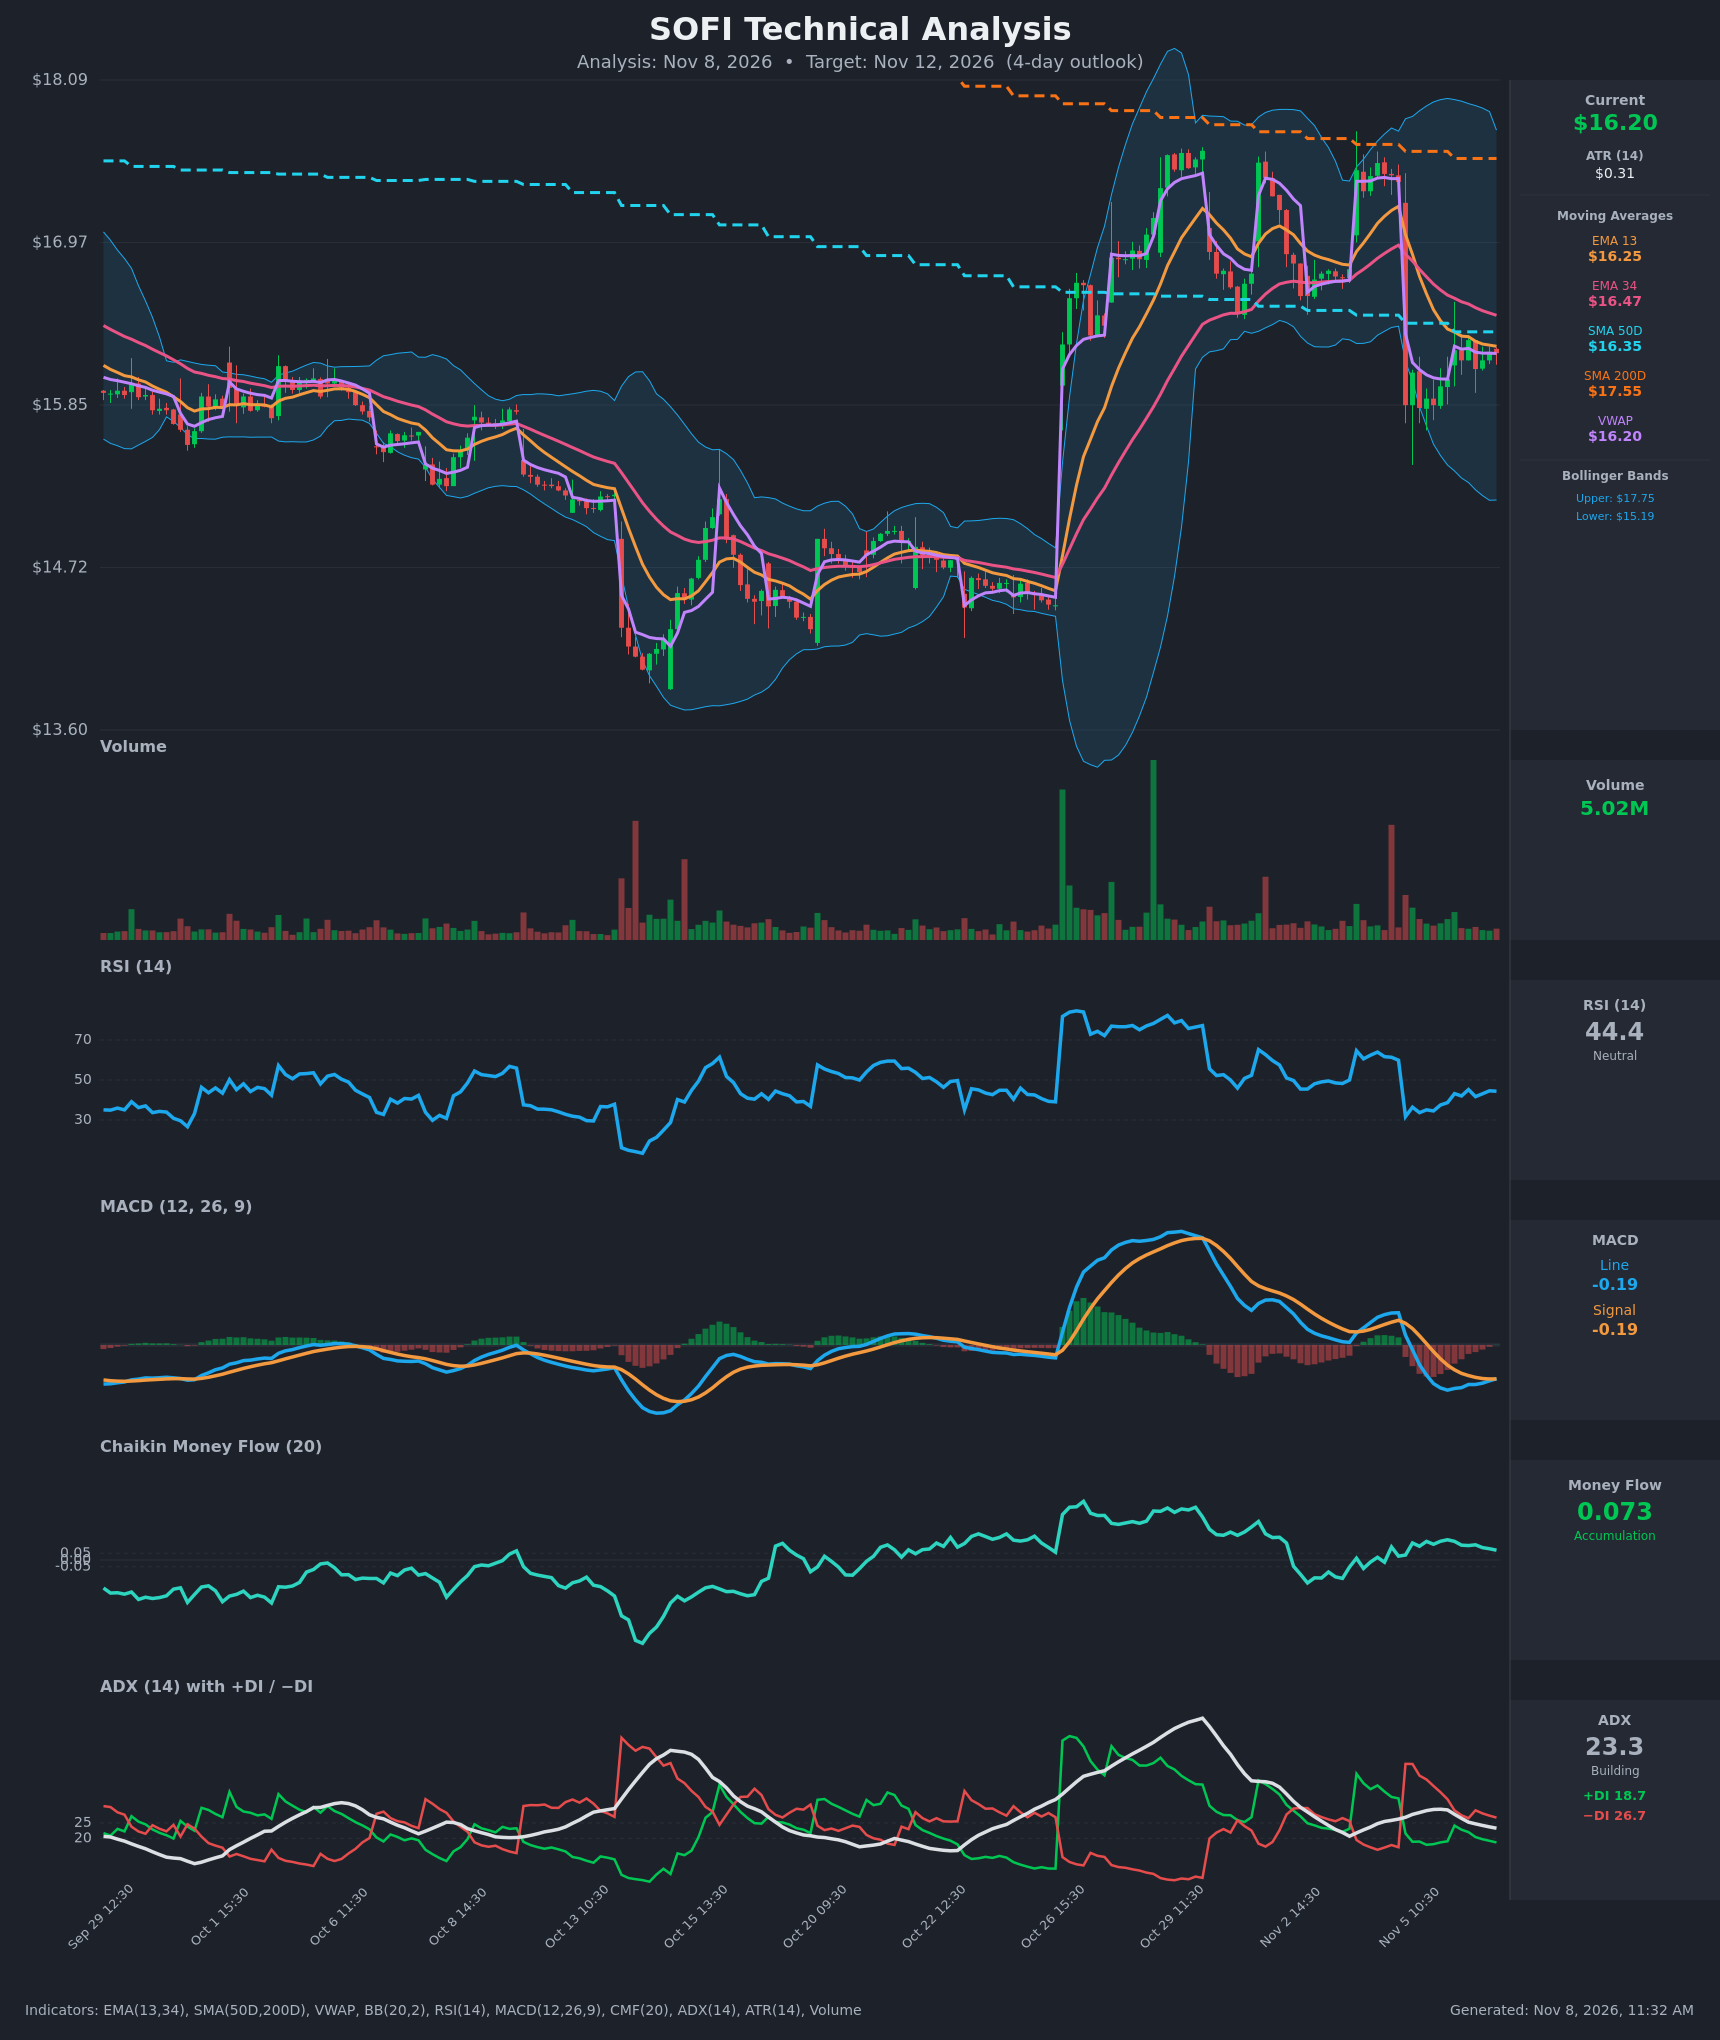
Analysis
TECHNICAL INDICATORS
- RSI (14): 44.38, below the 50 midline after bouncing from ~31.7 on Nov 5. It has been recovering (31.7 → 44) but is still capped below 50 and has stalled in the low-to-mid 40s over the last several bars. Momentum is neutral to mildly bearish, with a slight recovery bias. [Neutral]
- 20 EMA: The chart gives EMA 13 at $16.2525 and EMA 34 at $16.4665. Price at $16.205 sits just below EMA13 and below EMA34, so both act as overhead resistance. EMA13 crossed below EMA34 on Nov 5 (a bearish cross), and the gap is still wide. [Bearish]
- MACD: Line -0.1859 vs signal -0.1872. The line is just barely above the signal after rising from -0.249, which is a marginal bullish crossover. The histogram is flat to slightly positive, and both lines are below zero. This is a weak, early momentum stabilization, not a confirmed bullish turn. [Neutral]
- Bollinger Bands (20): Upper $17.7477, lower $15.1888, midline about $16.47. Price is in the lower half of the bands, below the midline, and the bands are still wide after the late-October spike. There is no squeeze or band-edge extreme, and the midline (~$16.47) is overhead resistance. [Neutral]
- CMF (20): 0.073, above the +0.05 threshold, but it has drifted down from 0.15 on Nov 5. Buying pressure is still mildly positive but fading. [Accumulation]
- ADX (14): 23.3 and falling from 29.4, so trend strength is moderate and fading. −DI (26.7) is above +DI (18.7), so bears hold control, although the spread has narrowed from 44 vs 19. [Weak/Moderate Trend, Bearish direction]
- Volume: 5.02M, modest and below the spikes at the Nov 5 gap-down and the late-October surge. The rebound from the Nov 5 low has come on light volume, so conviction is low. [Low-conviction consolidation]
DIVERGENCES & TRENDS
- Price is lower after the Nov 5 gap-down (from $17.39 to $15.85), then has recovered to ~$16.20. RSI, MACD and CMF have all stabilized or improved since then, a mild bullish divergence in short-term momentum, but there is no confirmed structural divergence.
- EMA13 ($16.25) has crossed below EMA34 ($16.47), a bearish short-term trend signal. Price is below both EMAs.
- Price is below SMA200D ($17.55), a long-term downtrend. It is also slightly below SMA50D ($16.35), which is just overhead. No golden or death cross is occurring, with SMA50D sitting below SMA200D.
- Price is sitting at VWAP ($16.2028), so there is no edge from VWAP.
- The MACD line is marginally crossing above the signal near -0.19, but it is still below zero.
- ADX is declining while −DI > +DI, which suggests the Nov 5 sell-off trend is losing steam and a range may form.
- Price is squeezed between EMA13 ($16.25), SMA50D ($16.35) and EMA34 ($16.47) overhead and the Nov 5 lows (~$15.82) below.
CHART PATTERNS
- After the Nov 5 gap-down, price formed a small base at $15.82–$16.30 with a rising low sequence. This loosely resembles a Bullish Flag/consolidation after a sharp drop, but it is more accurately a base under a resistance cluster, so it is not a clean reference pattern.
- The broader structure since Oct 26 is a spike to $17.4+ followed by a lower-high rollover, a partial Bearish Double Top (~$17.4 area, twice) with a neckline near $16.2–$16.3 that has now been broken. The measured move would be down toward ~$15.2 (the lower Bollinger Band), but price has already dropped most of the way and is bouncing.
- Overall: a bearish structure (double top, neckline break) with a short-term bounce that is stalling at the resistance cluster ($16.25–$16.47).
POTENTIAL SCENARIOS
- Scenario 1: Bearish Rejection at the MA Cluster — Price fails at EMA13/SMA50D/EMA34 ($16.25–$16.47), with −DI still on top and price below SMA200D, and fades back toward the Nov 5 lows. Trigger: rejection at ~$16.35 and a break below $16.00. Target: $15.80, then $15.50. Invalidation: close above $16.50. (45% probability)
- Scenario 2: Neutral Range Consolidation — Fading ADX and a flat MACD keep price in a $15.90–$16.50 range. Trigger: repeated tests of $16.00 and $16.40 without a break. Target: $16.10–$16.30. Invalidation: close outside $15.85–$16.55. (25% probability)
- Scenario 3: Bullish Recovery Break — The MACD cross, positive CMF and rising RSI lift price through the MA cluster. Trigger: close above $16.50 (EMA34) on rising volume. Target: $16.90–$17.20 (Bollinger midline to upper range). Invalidation: failure back below $16.20. (30% probability)
PRICE TARGETS
For the 4-day horizon, ATR is $0.31, so a typical 4-day move is about ±$0.62 (~2σ-ish ≈ $0.6–$0.8). Range width target is about 4–7% of price; ~$1.05 is ~6.5%.
- Target Price: $16.00 (4 days)
- Expected Range: $15.55 to $16.60 (width $1.05 ≈ 6.5% of current price)
- Key Levels: Support at $15.82, Resistance at $16.47
OVERALL BIAS
OVERALL BIAS: BEARISH - Price is below EMA13, EMA34 and SMA200D with −DI above +DI, and the EMA13/EMA34 bearish cross plus the broken double-top neckline point lower. The overhead MA cluster ($16.25–$16.47) should cap the weak bounce, while fading CMF and light-volume recovery limit upside, so a drift toward $16.00 is the most likely outcome.
This is educational analysis and not financial advice.