SOFI 6-day bearish forecast — Nov 8, 2026
- Bias: Bearish
- Timeframe: 6 days (made Nov 8, 2026, target date Nov 13, 2026)
- Price at analysis: $16.20
- Price target: $16.00
- Expected range: $15.50 – $16.50
- Result: Correct (-5.8%) — closed at $15.27 on Nov 13, 2026; quality score 75/100
Get a free AI analysis of SOFI today
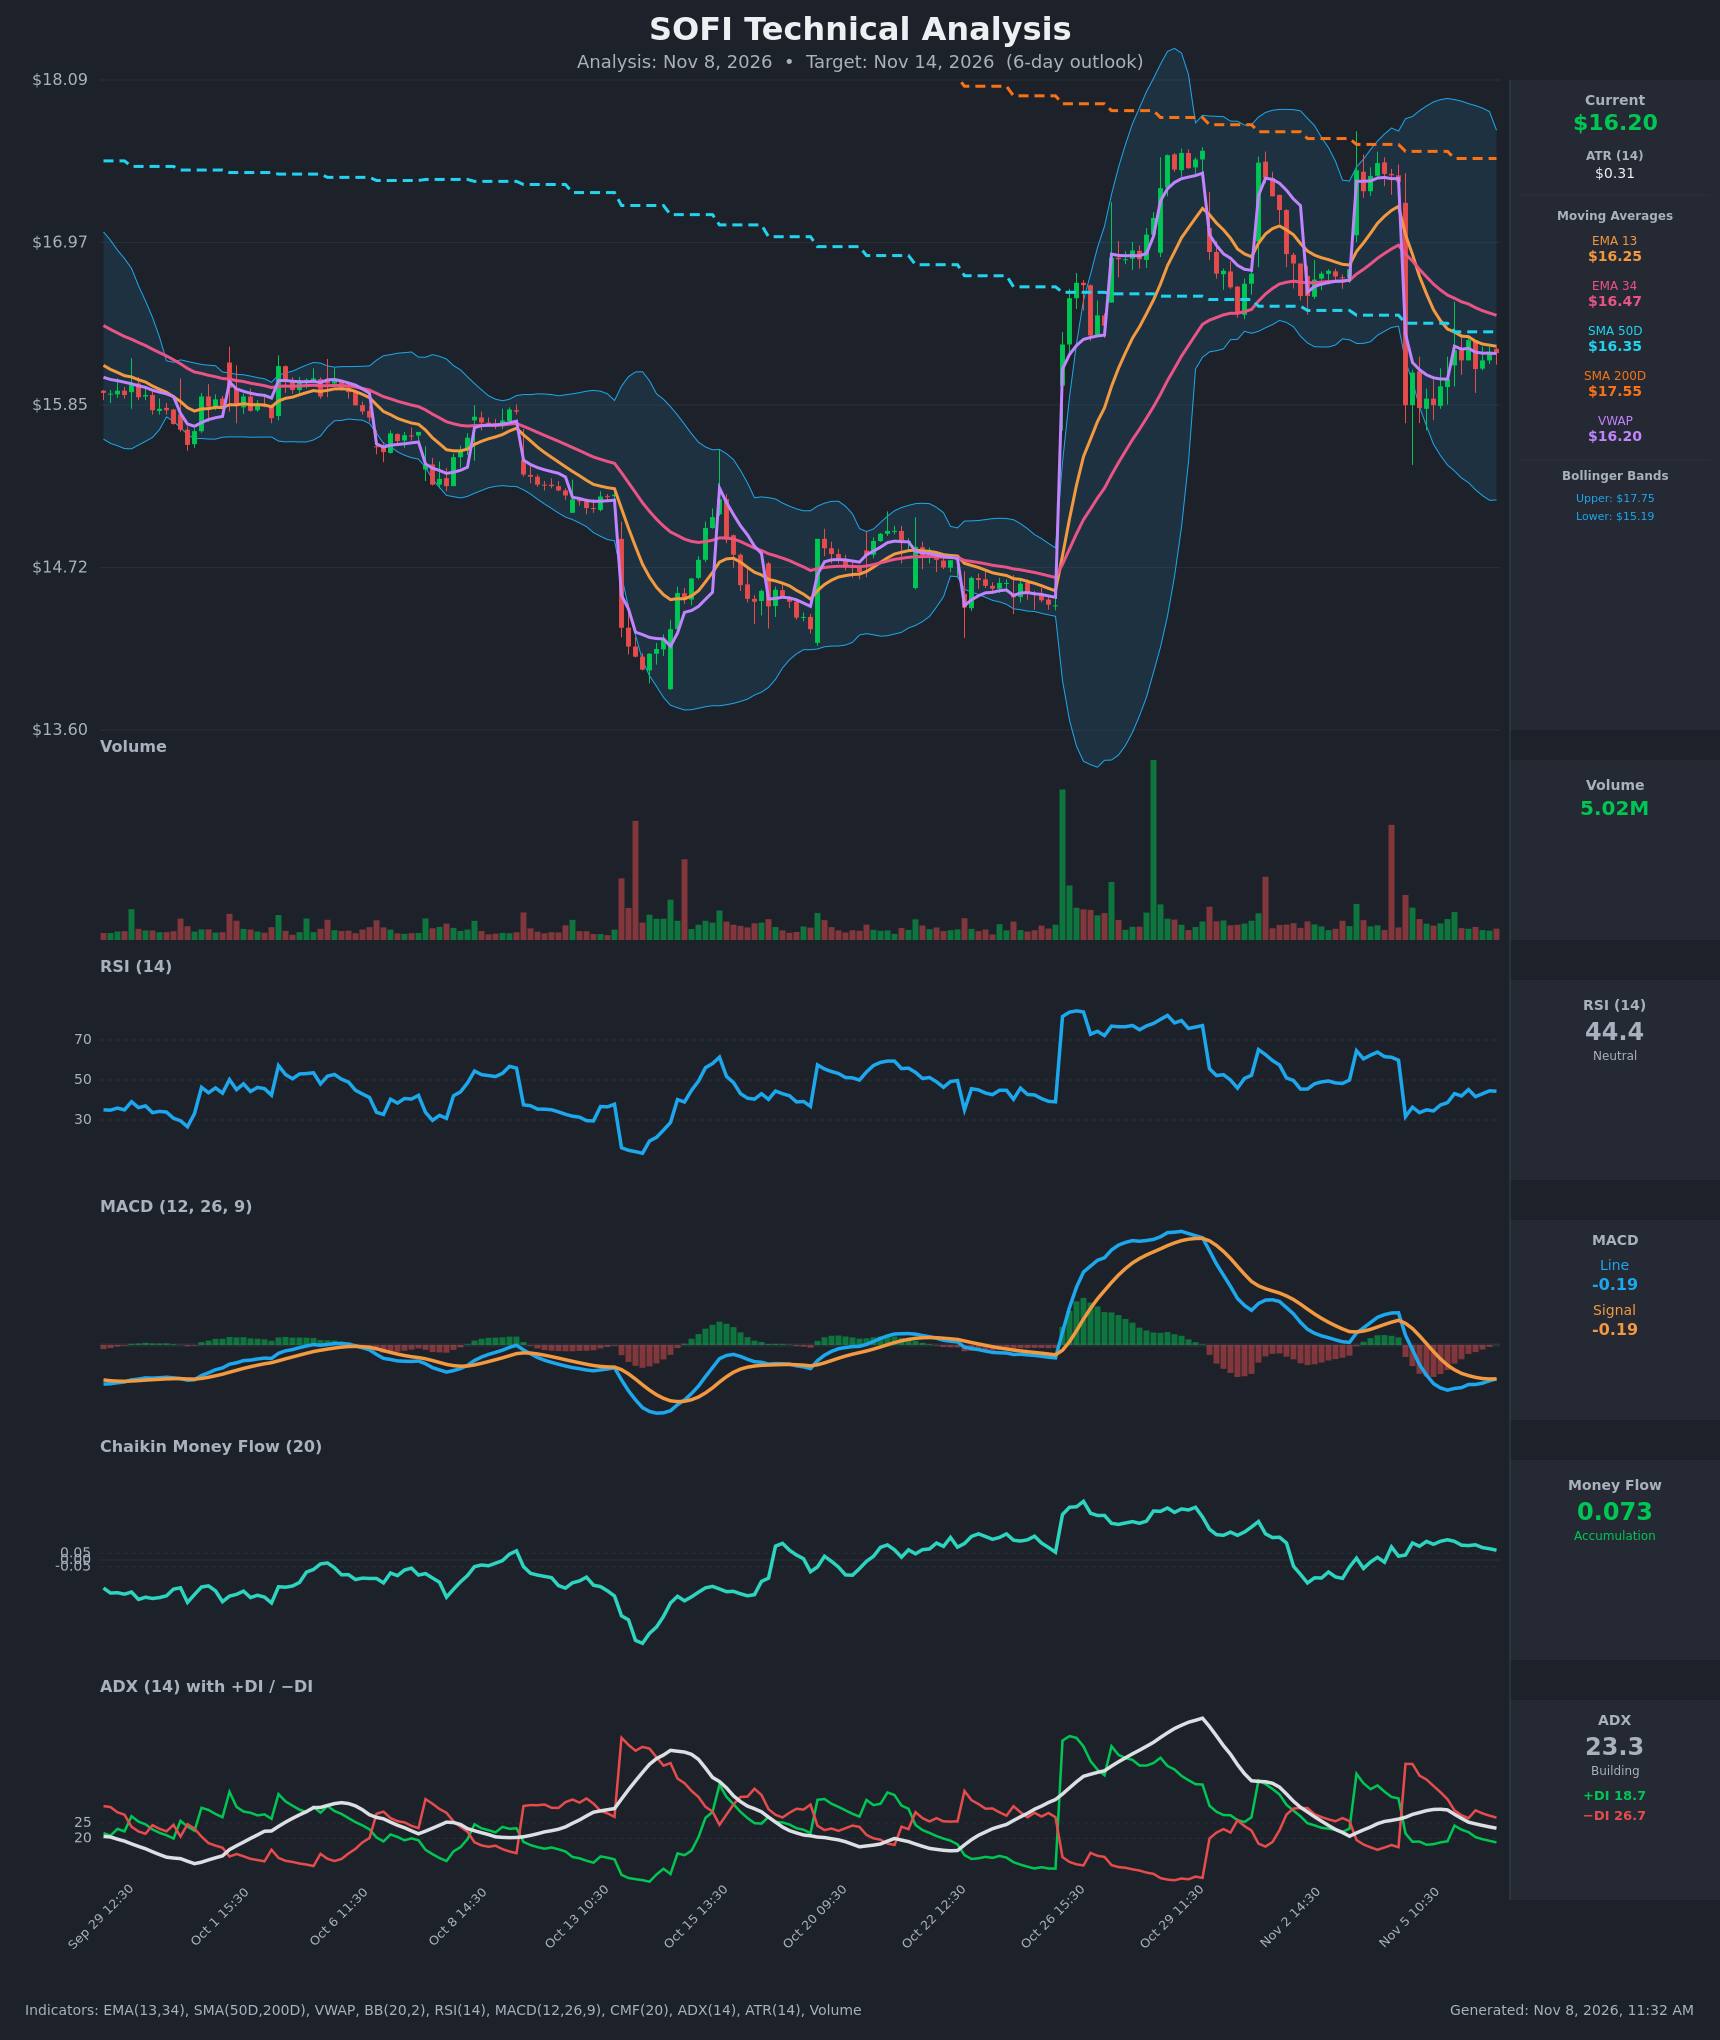
Analysis
TECHNICAL INDICATORS
- RSI (14): 44.38. It is below the 50 midline but has recovered from the 31.7 low on Nov 5 and is climbing slowly. Momentum is soft but improving, not oversold. [Neutral]
- 20 EMA: The data gives EMA 13 at $16.25 and EMA 34 at $16.47. Price at $16.205 is below both, and EMA13 is below EMA34 after a bearish cross on Nov 5. Both act as overhead resistance. [Bearish]
- MACD: Line is -0.1859 and signal is -0.1872, so the line has just ticked above the signal. The histogram is turning from negative to flat or slightly positive. Both lines are below zero, so this is an early, shallow bullish momentum turn inside a bearish structure. [Neutral]
- Bollinger Bands (20): Upper is $17.75 and lower is $15.19, so the bands are wide after the gap volatility. Price at $16.21 sits in the lower half, below the mid-band of about $16.47. The mid-band is the first resistance, and the bands give no squeeze or extreme signal. [Neutral]
- CMF (20): 0.073, above the +0.05 threshold but drifting lower from 0.15 on Nov 5. There is mild accumulation that is fading. [Accumulation]
- ADX (14): 23.3 and falling from 29.4, with −DI (26.7) above +DI (18.7). Bears still control, but the trend is weakening and the DI gap is narrowing. [Weak Trend, bearish direction]
- Volume: 5.02M, which is average to below average. The rebound from the Nov 5 gap-down came on light volume, so there is little conviction behind the bounce. VWAP is $16.2028, and price is pinned right at it. [Neutral to slightly bearish]
DIVERGENCES & TRENDS
- Price made higher intraday lows after the Nov 5 flush, with RSI rising from 31.7 to 44. This is a mild bullish momentum recovery, but it has not yet reclaimed the 50 midline.
- Bearish EMA13/EMA34 cross on Nov 5. SMA50D ($16.35) is below SMA200D ($17.55), so the long-term trend remains bearish (death cross structure). Price is below SMA200D.
- The MACD line is hugging the signal line with a marginal bullish cross, but it is below zero and has little power.
- −DI has been falling from 44 to 26.7 while ADX declines, so selling pressure is fading but bulls have not taken over.
- CMF stays positive while price falls, a mild bullish divergence, though CMF is trending lower.
- Price is stuck beneath a cluster of resistance: EMA13 $16.25, SMA50D $16.35 and EMA34 $16.47.
CHART PATTERNS
- After the sharp gap-down from about $17.39 to about $15.85, price has formed a small, tight consolidation between roughly $15.82 and $16.30. This resembles a Bearish Flag/Pennant (continuation) from the reference diagram. The flagpole is the Nov 5 drop. A breakdown below $15.82 would project a measured move toward about $15.2-15.3, which matches the lower Bollinger Band.
- The alternative reading is a Bullish Double Bottom/base, with lows near $15.82-15.85 on Nov 5. A close above $16.47 (EMA34) would confirm it, with a target toward $17.0-17.4, but the volume and MA structure do not yet support it.
- Net, the pattern is slightly more bearish than bullish because the rebound is weak, but it is not decisive.
POTENTIAL SCENARIOS
- Scenario 1: Bearish Flag Breakdown / Rejection at MAs — Price fails at the EMA13/SMA50D cluster ($16.25-$16.35), rolls over below VWAP, and retests the Nov 5 lows. Trigger: rejection at $16.30-$16.47 or a break below $16.00. Target: $15.80, with an extension to $15.50. Invalidation: a daily close above $16.50. (45% probability)
- Scenario 2: Bullish Relief Rally — The MACD cross, positive CMF and the recovering RSI push price through the moving-average cluster toward the Bollinger mid-band and beyond. Trigger: a close above $16.47 (EMA34) on rising volume. Target: $16.80-$17.00. Invalidation: a break below $15.82. (35% probability)
- Scenario 3: Neutral Range Chop — With ADX falling, price stays between $15.85 and $16.40 around VWAP. Trigger: no break of either boundary. Target: $16.10-$16.30. Invalidation: a close outside $15.80-$16.50. (20% probability)
PRICE TARGETS
- Target Price: $16.00 (6-day horizon)
- Expected Range: $15.50 to $16.50 (width $1.00, about 6.2% of the current price, consistent with the 7-10 day guidance scaled down for 6 days)
- Key Levels: Support at $15.82, Resistance at $16.47
OVERALL BIAS
OVERALL BIAS: BEARISH - Price is below EMA13, EMA34, SMA50D and SMA200D (with SMA50D under SMA200D), −DI is above +DI, and the rebound is on light volume beneath a stacked resistance cluster. Fading ADX, a marginal MACD cross and positive CMF limit conviction, so the expected drift is modest, toward $16.00.
This is educational analysis and not financial advice.