HOOD 6-day bearish forecast — Nov 8, 2026
- Bias: Bearish
- Timeframe: 6 days (made Nov 8, 2026, target date Nov 13, 2026)
- Price at analysis: $80.91
- Price target: $79.20
- Expected range: $76.80 – $83.00
- Result: Correct (-5.3%) — closed at $76.60 on Nov 13, 2026; quality score 93/100
Get a free AI analysis of HOOD today
Analysis
TECHNICAL INDICATORS
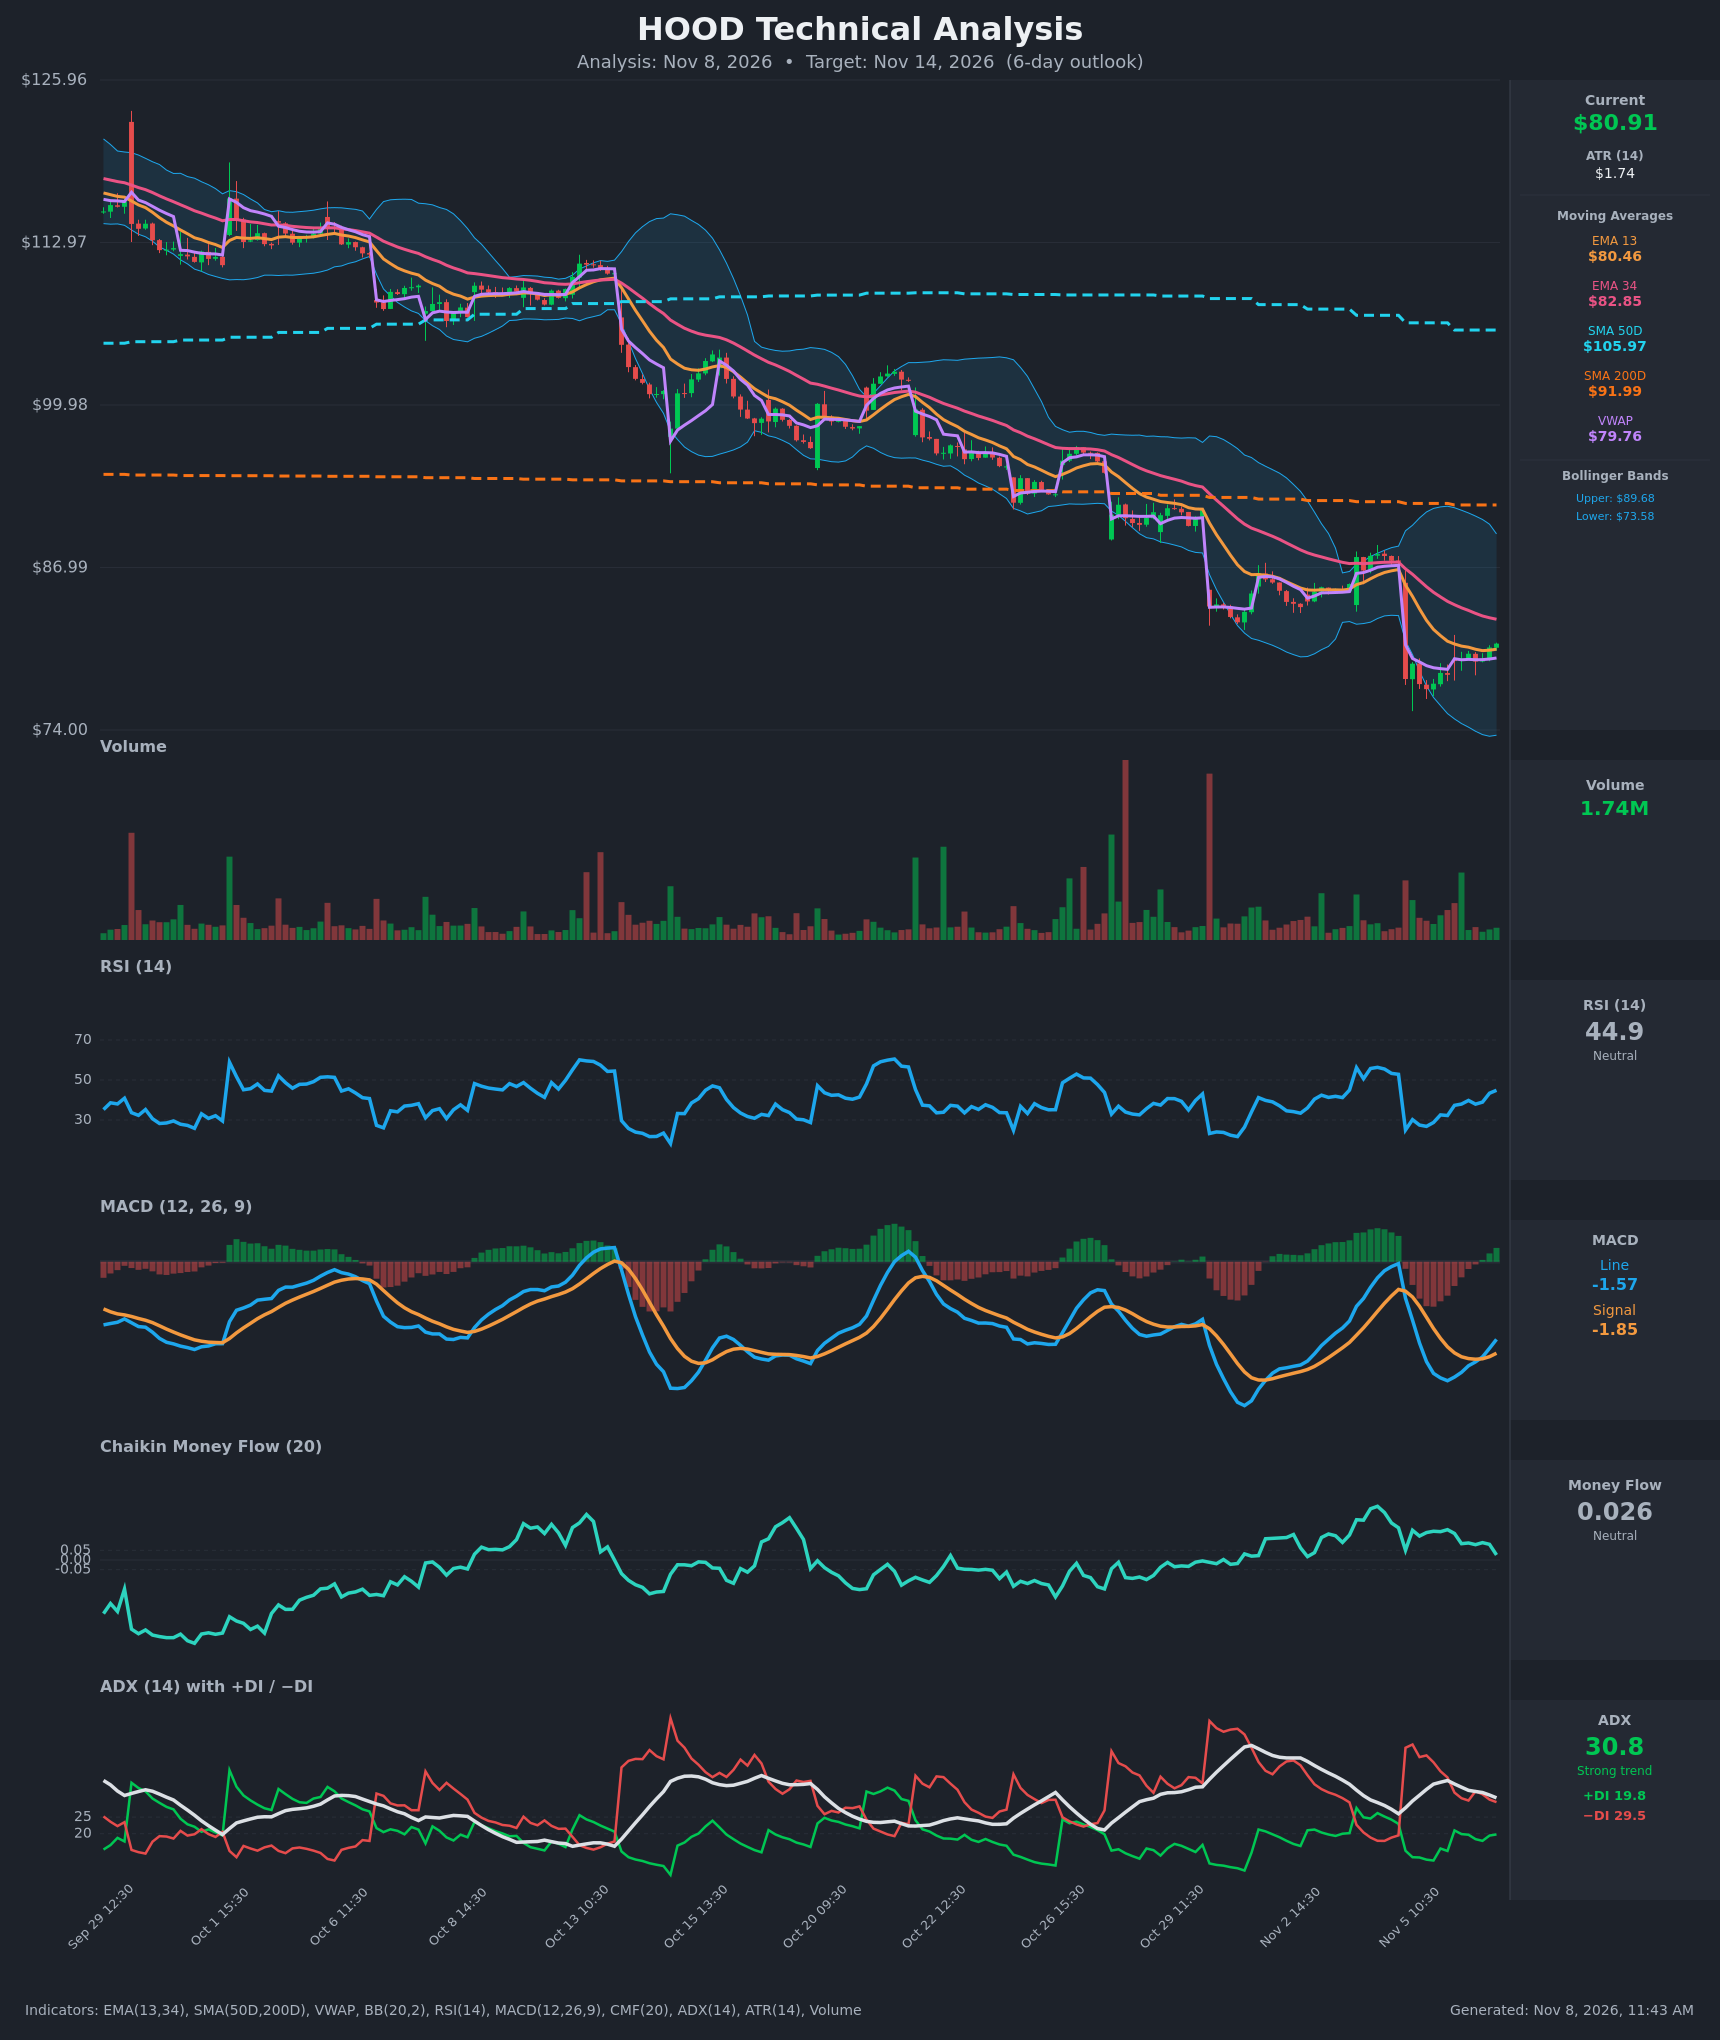
- RSI (14): 44.87, up from a deeply oversold 25.0 on Nov 5. Momentum is recovering, but the RSI is still below 50, a level that has capped every bounce in this downtrend. [Neutral]
- 20 EMA (13/34 shown): EMA13 is $80.46 and EMA34 is $82.85. Price ($80.91) is just above the EMA13, a minor short-term support. It is below the EMA34, which is declining and acts as overhead resistance. The EMA13 is below the EMA34 (bearish alignment), and the gap has narrowed from about $3.2 to $2.4. [Bearish]
- MACD: Line -1.568 and signal -1.848. The line is rising and has narrowed the gap to the signal, and the histogram has flipped slightly positive (+0.28). A bullish crossover has just formed, but both lines are well below zero, so this is a weak counter-trend bounce. [Bullish]
- Bollinger Bands (20): Upper $89.68, lower $73.58, midline about $81.63. Price tagged the lower band on Nov 5 and has bounced back to near the midline. The bands are wide after the volatility spike, and there is room to either side. [Neutral]
- CMF (20): 0.026, in the neutral zone (±0.05) and fading from 0.167 on Nov 4. Buying pressure behind the bounce is weakening. [Neutral]
- ADX (14): 30.8, a strong trend but slowly declining from 36.0. −DI (29.5) is well above +DI (19.8), so the bears are still in control. The gap has narrowed from the Nov 5 extreme (−DI 46.9 vs +DI 12.9), which shows selling pressure easing. [Strong Trend – Bearish]
- Volume: 1.74M, low and below the earlier selloff spikes. The rebound has come on light volume, which suggests weak conviction. [Bearish/Neutral – weak bounce]
Other context:
- Price is below the SMA50D ($105.97) and the SMA200D ($91.99), and the SMA50D is far above the SMA200D. That fits a long-term downtrend with a prior death cross.
- Price is above the VWAP ($79.76), a mild short-term positive.
DIVERGENCES & TRENDS
- Divergences: There is no clear bullish divergence. RSI and MACD are recovering from oversold levels, but price is only drifting sideways just above the Nov 5 low zone, so this is a momentum reset rather than a reversal signal.
- Trend: The long-term trend is a persistent staircase of lower highs and lower lows, with gap-downs on Oct 13, Oct 29 and Nov 5. Each bounce has stalled at or near the EMA34, and the next test sits at $82.85.
- Crossovers:
- MACD has crossed up above its signal line, which is bullish short term.
- The EMA13 is still below the EMA34, and no bullish cross has occurred.
- −DI remains above +DI.
- Price has reclaimed the VWAP and EMA13.
- Overall, the short-term momentum bounce is running into a strong higher-timeframe downtrend.
CHART PATTERNS
- Bearish Flag / Bearish Rising Wedge: After the sharp Nov 5 gap-down, price has made a small upward-sloping consolidation of higher lows and slightly higher highs on light volume. This resembles the bearish flag from the reference diagram, which is a continuation pattern. A break below about $79.0–79.5 (VWAP and flag support) would target the Nov 5 low zone near $76, with a measured move toward $73–74 (the lower Bollinger Band).
- Larger structure: The descending channel is intact, with the SMA50D and SMA200D both overhead.
- Invalidation: A close above the EMA34 ($82.85), and then the upper band area, would negate the flag.
POTENTIAL SCENARIOS
- Scenario 1: Bearish Flag Breakdown / Trend Continuation — The bounce stalls under the EMA34 and the MACD crossover fails below zero. With −DI dominant and ADX above 30, sellers push price back through VWAP and the EMA13. Trigger: hourly close below $79.50 (VWAP and EMA13). Target: $77.00 initially, then $75.50–76.00 (Nov 5 low). Invalidation: sustained close above $82.85. (50% probability)
- Scenario 2: Bullish Relief Bounce — Oversold RSI recovery and the MACD bullish crossover extend the rebound toward the Bollinger midline and EMA34. Trigger: break above $82.00 with rising volume. Target: $83.50–85.00 (prior consolidation around $84–87). Invalidation: close below $79.00. (35% probability)
- Scenario 3: Neutral Chop — Price stays pinned between VWAP ($79.76) and the EMA34 ($82.85) as ADX cools. Trigger: failure to break either $79.50 or $82.85. Target: $79.50–82.50. Invalidation: hourly close outside that range. (15% probability)
PRICE TARGETS
- Target Price: $79.20 (6-day horizon, mild downside as the bounce fades under the EMA34)
- Expected Range: $76.80 to $83.00 (width $6.20, about 7.7% of the current price, consistent with 6-day guidance)
- Key Levels: Support at $76.00 (Nov 5 low zone), Resistance at $82.85 (EMA34)
OVERALL BIAS
OVERALL BIAS: BEARISH - The long-term downtrend is intact (price below the SMA50D and SMA200D, ADX 30.8 with −DI above +DI, and lower highs capped at the EMA34). The bounce is occurring on light volume with fading CMF and a MACD crossover below zero, which fits a bearish flag.
This is educational analysis and not financial advice.