HOOD 4-day bearish forecast — Nov 8, 2026
- Bias: Bearish
- Timeframe: 4 days (made Nov 8, 2026, target date Nov 11, 2026)
- Price at analysis: $80.91
- Price target: $79.60
- Expected range: $78.20 – $82.20
- Result: Incorrect (+2.8%) — closed at $83.20 on Nov 11, 2026; quality score 19/100
Get a free AI analysis of HOOD today
Analysis
TECHNICAL INDICATORS
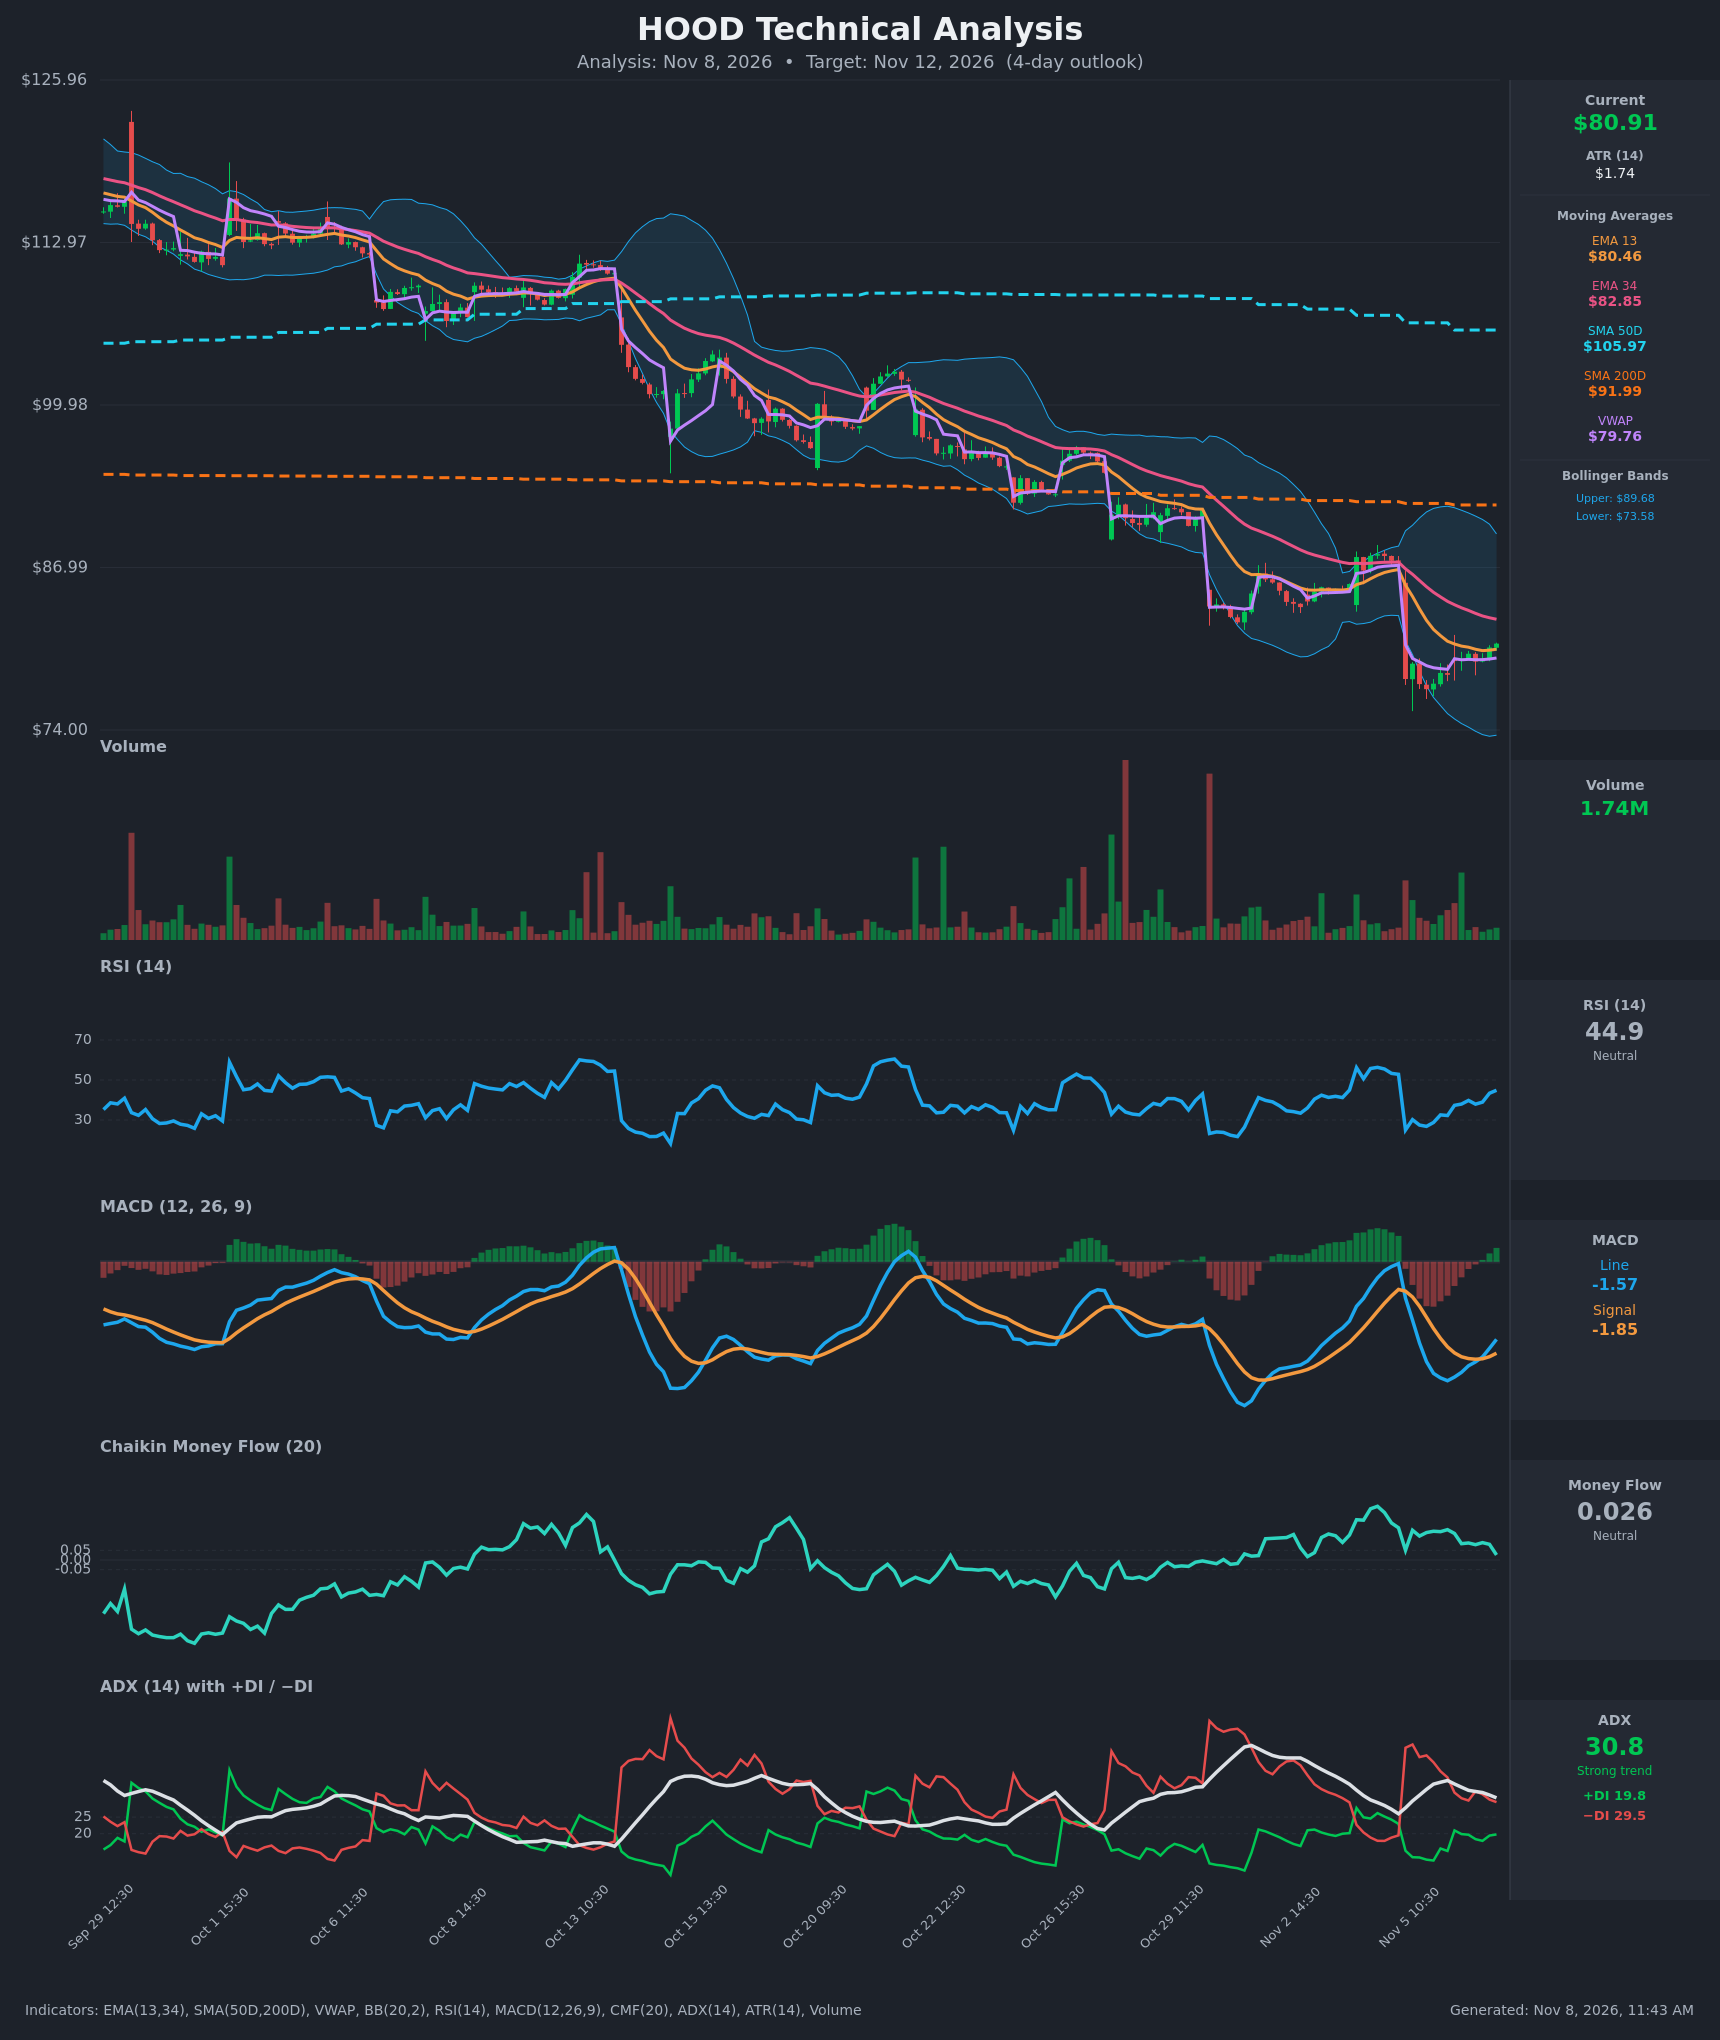
- RSI (14): 44.87, recovering from deeply oversold (25.0 on Nov 5) and rising for several bars. It is still below 50, so it hasn't regained bullish territory. The bounce is real but unconfirmed. [Neutral]
- 20 EMA: The chart shows EMA 13 at $80.46 and EMA 34 at $82.85. Price ($80.91) is just above the EMA 13, which is flat-to-rising and acts as minor support. Price is still below the EMA 34, which is sloping down and is the first real overhead resistance. EMA 13 is well below EMA 34, so the bearish crossover is intact. [Bearish]
- MACD: Line -1.57 vs signal -1.85. The line is rising and the histogram has just turned positive (the line is above the signal on the latest bar). This is an early bullish momentum crossover, but it is occurring deep below zero, which is typical of a relief bounce inside a downtrend. [Neutral]
- Bollinger Bands (20): Upper $89.68, lower $73.58, midline ~$81.63. Price is slightly below the midline after bouncing from the lower band area ($77 lows). The bands are wide after the Nov 5 gap down. A midline rejection would keep the bearish bias, while a close above it would favor a move toward $85. [Neutral]
- CMF (20): 0.026, inside the ±0.05 neutral zone and fading from earlier positive readings (0.15). There is no clear accumulation or distribution, and buying pressure on the bounce is not convincing. [Neutral]
- ADX (14): 30.8 and falling from 36. −DI (29.5) is above +DI (19.8), so bears are in control. The gap is narrowing (+DI rising, −DI falling), which means the downtrend is losing some steam but remains strong. [Strong Trend – Bearish]
- Volume: 1.74M, light and below the heavy-volume selloff bars on Nov 5. The bounce is happening on modest volume, which suggests weak conviction among buyers. [Weak confirmation of the bounce – mildly bearish]
Other levels:
- VWAP is $79.76, and price is above it, which is a short-term plus for bulls.
- Price is below the SMA200D ($91.99) and SMA50D ($105.97).
- SMA50D is far above SMA200D, but the long-term picture is a persistent downtrend of lower highs and lower lows.
DIVERGENCES & TRENDS
- No clear bullish divergence in price: The Nov 5 low (~$77) came with RSI at 25. Price has since made higher intraday lows ($77.27 → $77.70 → $78.41), and RSI has climbed in step. This is a momentum recovery rather than a classic divergence.
- Momentum: MACD has crossed above its signal line while still below zero, and RSI has risen from 25 to 45. These are signs of short-term relief.
- Trend: EMA 13 < EMA 34 < SMA200D < SMA50D (in terms of the recent hierarchy, price is below all long-term averages). The chart shows a persistent staircase decline from ~$115 to ~$80 with gap-down legs.
- DI convergence: +DI is rising and −DI falling, but there has been no bullish DI crossover. The trend is weakening but not reversed.
- Overhead resistance cluster: The EMA 34 ($82.85) and the Bollinger midline (~$81.6) sit directly above price. Each prior bounce in this downtrend has stalled at the EMA 34 or the midline.
CHART PATTERNS
- Bearish Flag / Rising Wedge (continuation): After the sharp Nov 5 gap-down "flagpole" ($87 → $77), price is drifting up in a narrow, rising channel with higher lows and weak volume. This matches the Bearish Flag and Bearish Pennant patterns in the diagram. A breakdown below the flag support (~$79) would project toward $77 and lower. The measured-move target is the pole height (~$9–10) projected from the breakdown, so $70 or below, though that is beyond a 4-day horizon.
- Possible Bullish Falling Wedge (lower probability): The longer-term sequence of lower highs and lower lows has some wedge character. The bounce would only be validated by a close above $82.85 with expanding volume.
- Overall, the flag/pennant structure favors a continuation of the downtrend.
POTENTIAL SCENARIOS
- Scenario 1: Bearish Flag Breakdown / Rejection at EMA 34 — The bounce stalls beneath the EMA 34 and Bollinger midline, the low-volume rally fades, and price rolls back through VWAP. Trigger: failure at $81.6–$82.85 and a close below VWAP/EMA 13 (~$79.75–$80.45). Target: $78.00, then the Nov 5 low zone of $77.30. Invalidation: a daily close above $82.85 on rising volume. (50% probability)
- Scenario 2: Bullish Relief Rally — The MACD crossover and recovering RSI extend the bounce, and price breaks above the EMA 34. Trigger: a close above $82.85 with volume above ~2.5M. Target: $84.50–$85.50. Invalidation: a drop back below $79.50. (32% probability)
- Scenario 3: Neutral Consolidation — Price chops between VWAP/EMA 13 and the EMA 34 as ADX cools. Trigger: price holds $79.50–$82.50. Target: $80–$82. Invalidation: a break outside the range. (18% probability)
PRICE TARGETS
- Target Price: $79.60 (4-day horizon, about -1.6% from $80.905)
- Expected Range: $78.20 to $82.20 (width $4.00, about 4.9% of price, consistent with a ~4-day horizon)
- Key Levels: Support at $77.30, Resistance at $82.85
OVERALL BIAS
OVERALL BIAS: BEARISH - A strong ADX with −DI in control, price below every major moving average, and a bearish flag after the Nov 5 gap-down on weak volume outweigh the early MACD crossover and RSI recovery. The EMA 34 ($82.85) is the key resistance for the bounce to fail at.
This is educational analysis and not financial advice.