SOXS 6-day bearish forecast — Nov 8, 2026
- Bias: Bearish
- Timeframe: 6 days (made Nov 8, 2026, target date Nov 13, 2026)
- Price at analysis: $70.98
- Price target: $68.20
- Expected range: $66.00 – $73.00
- Result: Correct (-25.5%) — closed at $52.85 on Nov 13, 2026; quality score 50/100
Get a free AI analysis of SOXS today
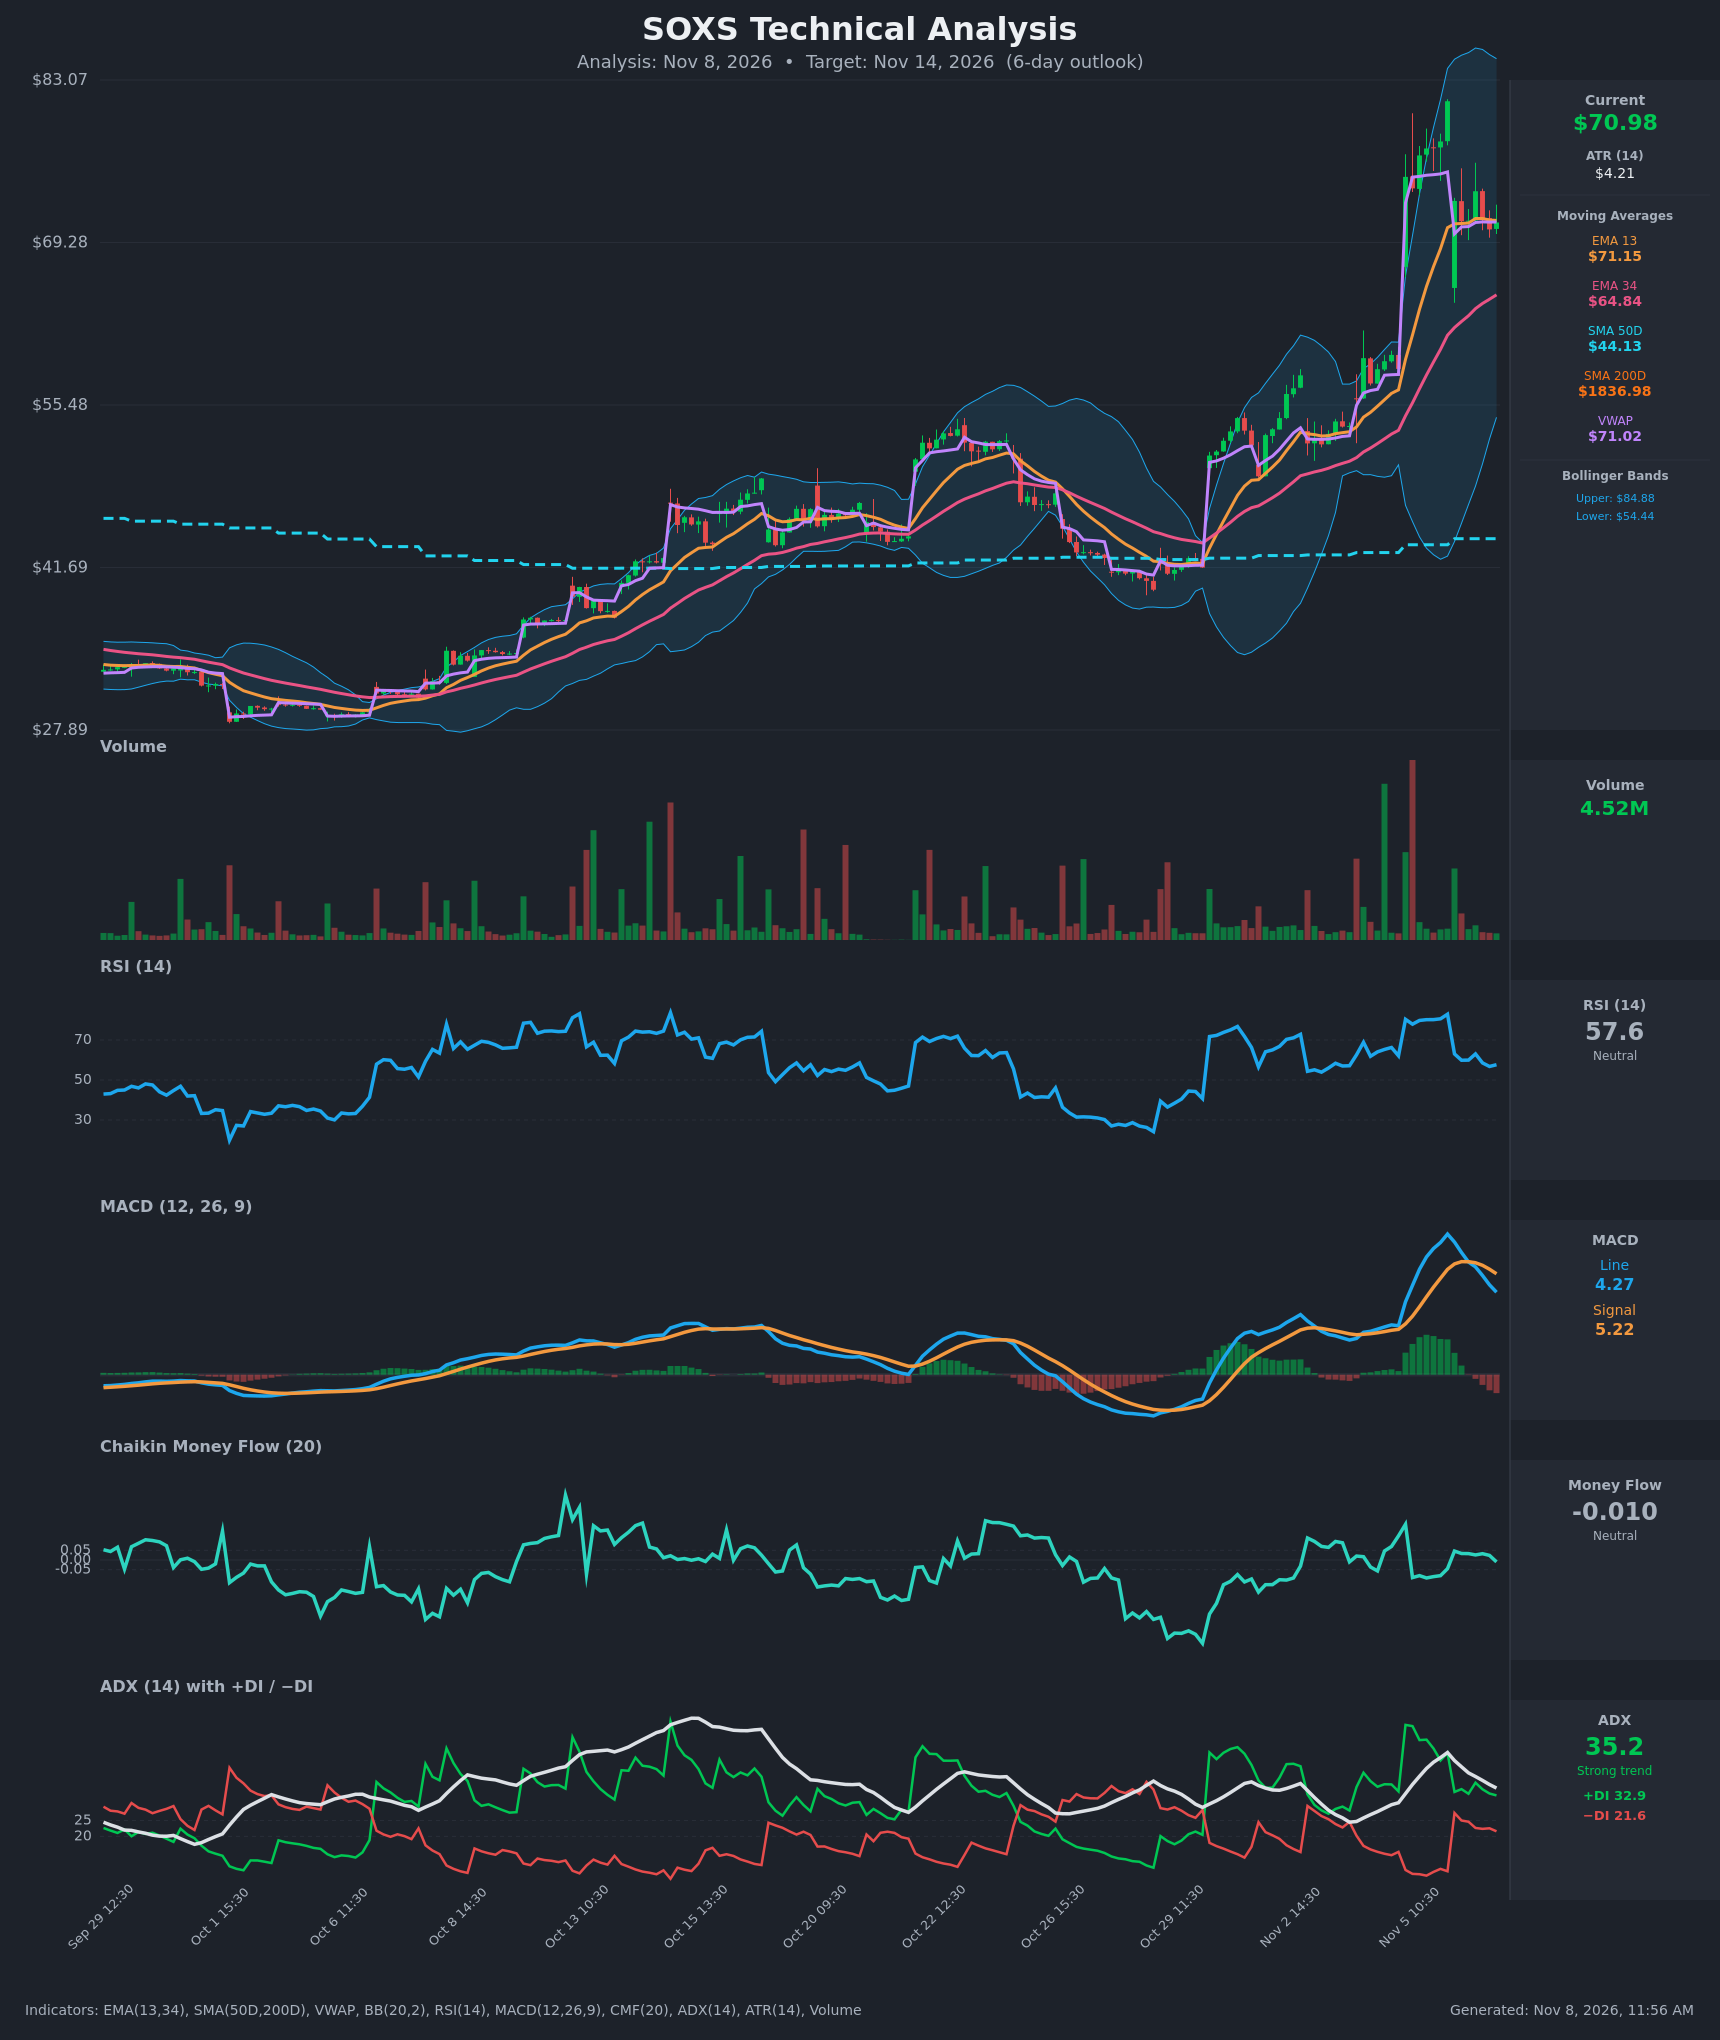
Analysis
TECHNICAL INDICATORS
- RSI (14): 57.64, down from 82.9 at the Nov 5 peak and now sliding back toward the 50 midline. Momentum has cooled from extreme overbought but is still above neutral. [Neutral]
- 20 EMA: The chart shows EMA 13 ($71.15) and EMA 34 ($64.84). Price at $70.98 is sitting right on EMA13 and has been chopping around it for 7 bars, so support is marginal. It remains well above EMA34, so the short-term trend is intact but stalling. [Neutral]
- MACD: Line 4.27 is below Signal 5.22 after a bearish crossover on Nov 6 around 11:30. The histogram has turned negative and is expanding, and both lines are rolling over from their Nov 5 highs. [Bearish]
- Bollinger Bands (20): Upper $84.88, lower $54.44, midline about $69.66. The bands are very wide after the volatility spike. Price has retreated from the upper band and is just above the midline, so a test of the midline is plausible. [Neutral]
- CMF (20): -0.010, inside the ±0.05 neutral zone. It faded from +0.125 to flat and slightly negative, so buying pressure has evaporated without clear distribution. [Neutral]
- ADX (14): 35.2 and falling from 46.4. +DI (32.9) is above −DI (21.6), but the gap has narrowed sharply from 46/9. The trend is strong but weakening. [Strong Trend, fading, bullish-leaning]
- Volume: 4.52M, fading after the spike-day surge. Rebound attempts after the gap-down came on declining volume, so conviction is low. [Waning participation, mildly bearish]
DIVERGENCES & TRENDS
- The Nov 5 high of $81.27 came with RSI near 83, and price has since made lower highs ($73.63 vs. $81.27). RSI and MACD momentum are fading faster than price, which is mild bearish momentum deterioration.
- MACD crossed down and the histogram is deepening. This is the main confirmed bearish signal.
- ADX has peaked and is rolling over while +DI and −DI converge. The impulsive up-leg is losing steam.
- Price is pinned to EMA13 ($71.15) and VWAP ($71.02), which shows equilibrium. There is no EMA crossover: EMA13 is still above EMA34 with a wide gap.
- The SMA200D reading of $1836.98 is far from price and looks distorted (probably split-adjustment related). I'm disregarding it. SMA50D ($44.13) is far below price, confirming a stretched, extended rally.
- SOXS is a 3x inverse leveraged ETF, so sharp spikes tend to mean-revert and decay.
CHART PATTERNS
- After the vertical spike from about $58 to $81, price has consolidated in a tight $70.4–$73.6 range. This resembles a Bullish Flag/Pennant from the reference diagram, but the flag's downward slope is shallow and momentum is deteriorating.
- The same structure could also be a Bearish Double Top (the $77–$81 area), with a break below $70.4 targeting the gap area near $64–$65.
- The pennant is unresolved. A measured-move bullish breakout would need a close above $73.63, with a target near $78–$80. A break below $70.4 would target the EMA34 area near $65.
POTENTIAL SCENARIOS
- Scenario 1: Bearish Fade Toward EMA34 — The MACD bearish cross, fading RSI and ADX, and waning volume lead to a breakdown of the consolidation and a retracement of part of the gap. Trigger: close below $70.39 with VWAP lost. Target: $65–$67, with a possible extension to $64.84 (EMA34). Invalidation: close above $73.63. (45% probability)
- Scenario 2: Bullish Flag Breakout — Price holds EMA13/VWAP and breaks out of the consolidation, with +DI still dominant. Trigger: close above $73.63 on rising volume. Target: $78–$80. Invalidation: close below $69.66 (BB midline). (33% probability)
- Scenario 3: Neutral Range Chop — Price keeps oscillating around $70–$73 as volatility compresses. Trigger: ADX continues to drop with no break of range edges. Target: $69–$72. Invalidation: a close outside $69–$74. (22% probability)
PRICE TARGETS
- Target Price: $68.20 (6-day horizon)
- Expected Range: $66.00 to $73.00 (width $7.00 ≈ 9.9% of price, a bit wider than the typical 6-day band because ATR is about 6% of price)
- Key Levels: Support at $64.84, Resistance at $73.63
OVERALL BIAS
OVERALL BIAS: BEARISH - The MACD bearish crossover with a widening negative histogram, falling RSI and ADX, and fading volume after a parabolic spike point to a pullback toward the BB midline and EMA34. The fade is only modestly favored, because price is still above EMA34 with +DI over −DI.
This is educational analysis and not financial advice.