SOXS 4-day bearish forecast — Nov 8, 2026
- Bias: Bearish
- Timeframe: 4 days (made Nov 8, 2026, target date Nov 11, 2026)
- Price at analysis: $70.98
- Price target: $68.50
- Expected range: $67.00 – $72.00
- Result: Correct (-33.1%) — closed at $47.49 on Nov 11, 2026; quality score 50/100
Get a free AI analysis of SOXS today
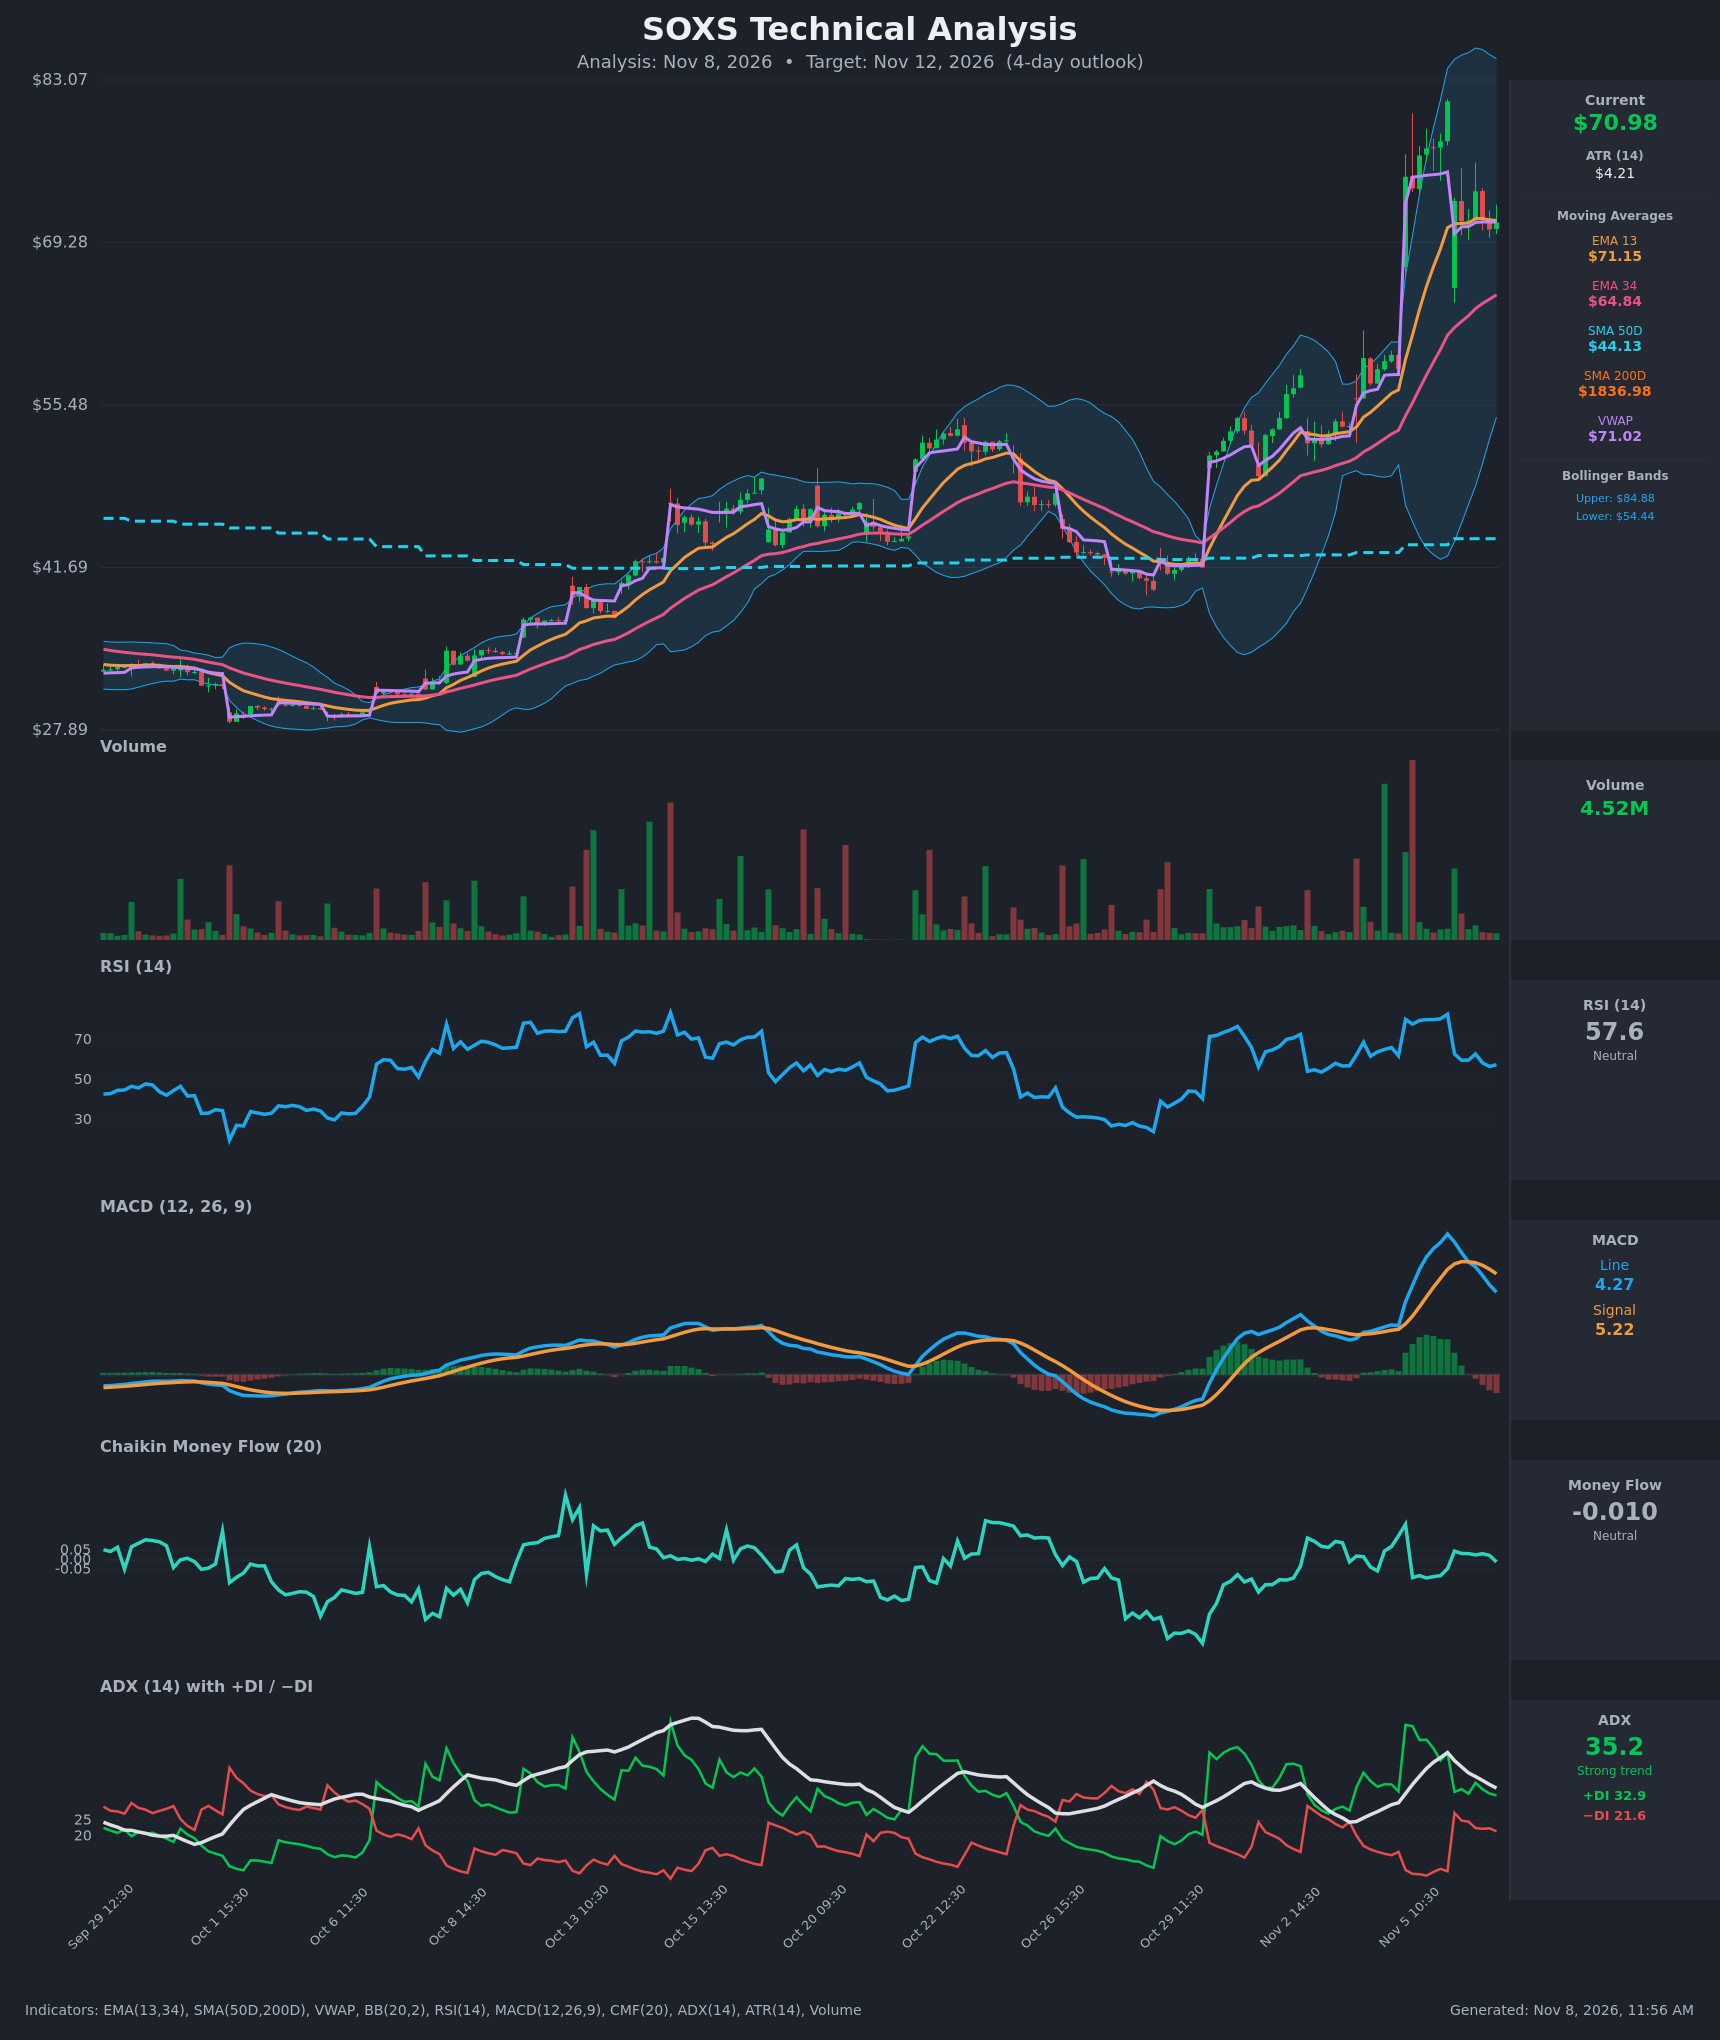
Analysis
TECHNICAL INDICATORS
- RSI (14): 57.64, down from the 80+ overbought readings on Nov 5 and now near the middle of the range. Momentum is fading but has not reached bearish territory (<50). [Neutral]
- 20 EMA: The chart supplies EMA 13 ($71.15) and EMA 34 ($64.84). Price at $70.98 sits just under the EMA13 and has been oscillating around it for 7 bars, so it is acting as mild resistance. It is still well above the EMA34, which is the next dynamic support. The EMA13 is above the EMA34, so the larger trend remains up. [Neutral]
- MACD: The line (4.27) crossed below the signal (5.22) on Nov 6 around 11:30–12:30, and the histogram is now negative and widening. The line has rolled over from its peak of about 7.3. This is a clear bearish momentum crossover, although both lines are still above zero. [Bearish]
- Bollinger Bands (20): The bands are very wide (upper $84.88, lower $54.44, midline about $69.66) after the spike. Price is just above the midline and has retreated from the upper band area. Band width suggests volatility stays high, with a pull-back toward the midline or lower likelier than a run at the upper band. [Neutral]
- CMF (20): -0.010, inside the ±0.05 neutral zone. It slipped from slightly positive (+0.03) to slightly negative, so there is no real accumulation behind the bounce. [Neutral]
- ADX (14): 35.2 and falling from a peak of 46.4. +DI is at 32.9 and −DI at 21.6, so bulls are still on top, but the gap has narrowed sharply from 46 vs 9. The trend is strong but weakening, which typically fits consolidation or a corrective pullback. [Strong Trend, weakening, bullish-leaning]
- Volume: 4.52M, well below the spike-day surge (the large bars on Nov 5). The post-spike consolidation is on declining volume, so there is no conviction in either direction. The failed follow-through after the 81 high is a mild negative. [Neutral / fading interest]
DIVERGENCES & TRENDS
- Price is roughly flat, with a failed push to about $81 followed by a gap down to $72.81. MACD and RSI have both rolled over and are making lower highs, a momentum deceleration (a mild bearish divergence relative to the spike high).
- A bearish MACD crossover has occurred, while the EMA13/EMA34 gap remains positive. No EMA bearish cross yet, but the EMA13 is flattening at about $71.
- Price is hugging VWAP ($71.02), which signals balanced buying and selling.
- ADX is declining from 46 while the DI spread compresses, so the impulsive phase is over.
- SMA50D ($44.13) is far below price. The SMA200D value ($1836.98) looks distorted by split adjustments, so I'm disregarding golden/death cross signals from it.
CHART PATTERNS
- Following the vertical spike, price is forming a tight, slightly descending consolidation between about $70.4 and $73.6. This resembles a Bullish Pennant/Flag (continuation) from the reference diagram, but the MACD cross and declining volume weaken that read.
- The spike-and-gap-down also fits a short-term blow-off top (a loose "Bearish Double Top" near $77–81 intraday). Support is around $70.4. A close below it would target about $65–67, a measured move of roughly the consolidation height plus a retest of the EMA34.
- A breakout above $73.6 would aim for $77–78 and then the $81 high.
POTENTIAL SCENARIOS
- Scenario 1: Bearish Pullback Toward EMA34 — Momentum is fading (MACD bearish cross, falling RSI and ADX) and price fails to hold the EMA13/VWAP confluence near $71. Trigger: a break and hourly close below $70.40. Target: $67.00–$65.00 (EMA34 zone). Invalidation: a close above $73.60. (45% probability)
- Scenario 2: Bullish Pennant Breakout — Price holds above the EMA13/VWAP and breaks out of the tight consolidation, with +DI still dominant. Trigger: a close above $73.60 on rising volume. Target: $77–$78. Invalidation: a close below $69.50. (35% probability)
- Scenario 3: Neutral Chop — Price keeps oscillating around VWAP and the EMA13 on low volume. Trigger: no breakout from the $70.4–$73.6 range. Target: $69.5–$72.5. Invalidation: a break of either range boundary. (20% probability)
PRICE TARGETS
- Target Price: $68.50 (4-day horizon, about -3.5%)
- Expected Range: $67.00 to $72.00 (width $5.00, about 7% of current price, appropriate for a 4-day window on a high-volatility leveraged ETF)
- Key Levels: Support at $64.84 (EMA34), Resistance at $73.60
OVERALL BIAS
OVERALL BIAS: BEARISH - The MACD bearish crossover, fading RSI and ADX, and low-volume consolidation under the EMA13/VWAP point to a drift lower toward the midline of the Bollinger Bands and the EMA34 area. The uptrend structure (+DI above −DI, price above EMA34) limits the downside and keeps conviction modest.
This is educational analysis and not financial advice.