AAPL 4-day bearish forecast — Nov 8, 2026
- Bias: Bearish
- Timeframe: 4 days (made Nov 8, 2026, target date Nov 11, 2026)
- Price at analysis: $342.37
- Price target: $339.50
- Expected range: $334.50 – $348.50
- Result: Incorrect (+4.1%) — closed at $356.30 on Nov 11, 2026; quality score 8/100
Get a free AI analysis of AAPL today
Analysis
TECHNICAL INDICATORS
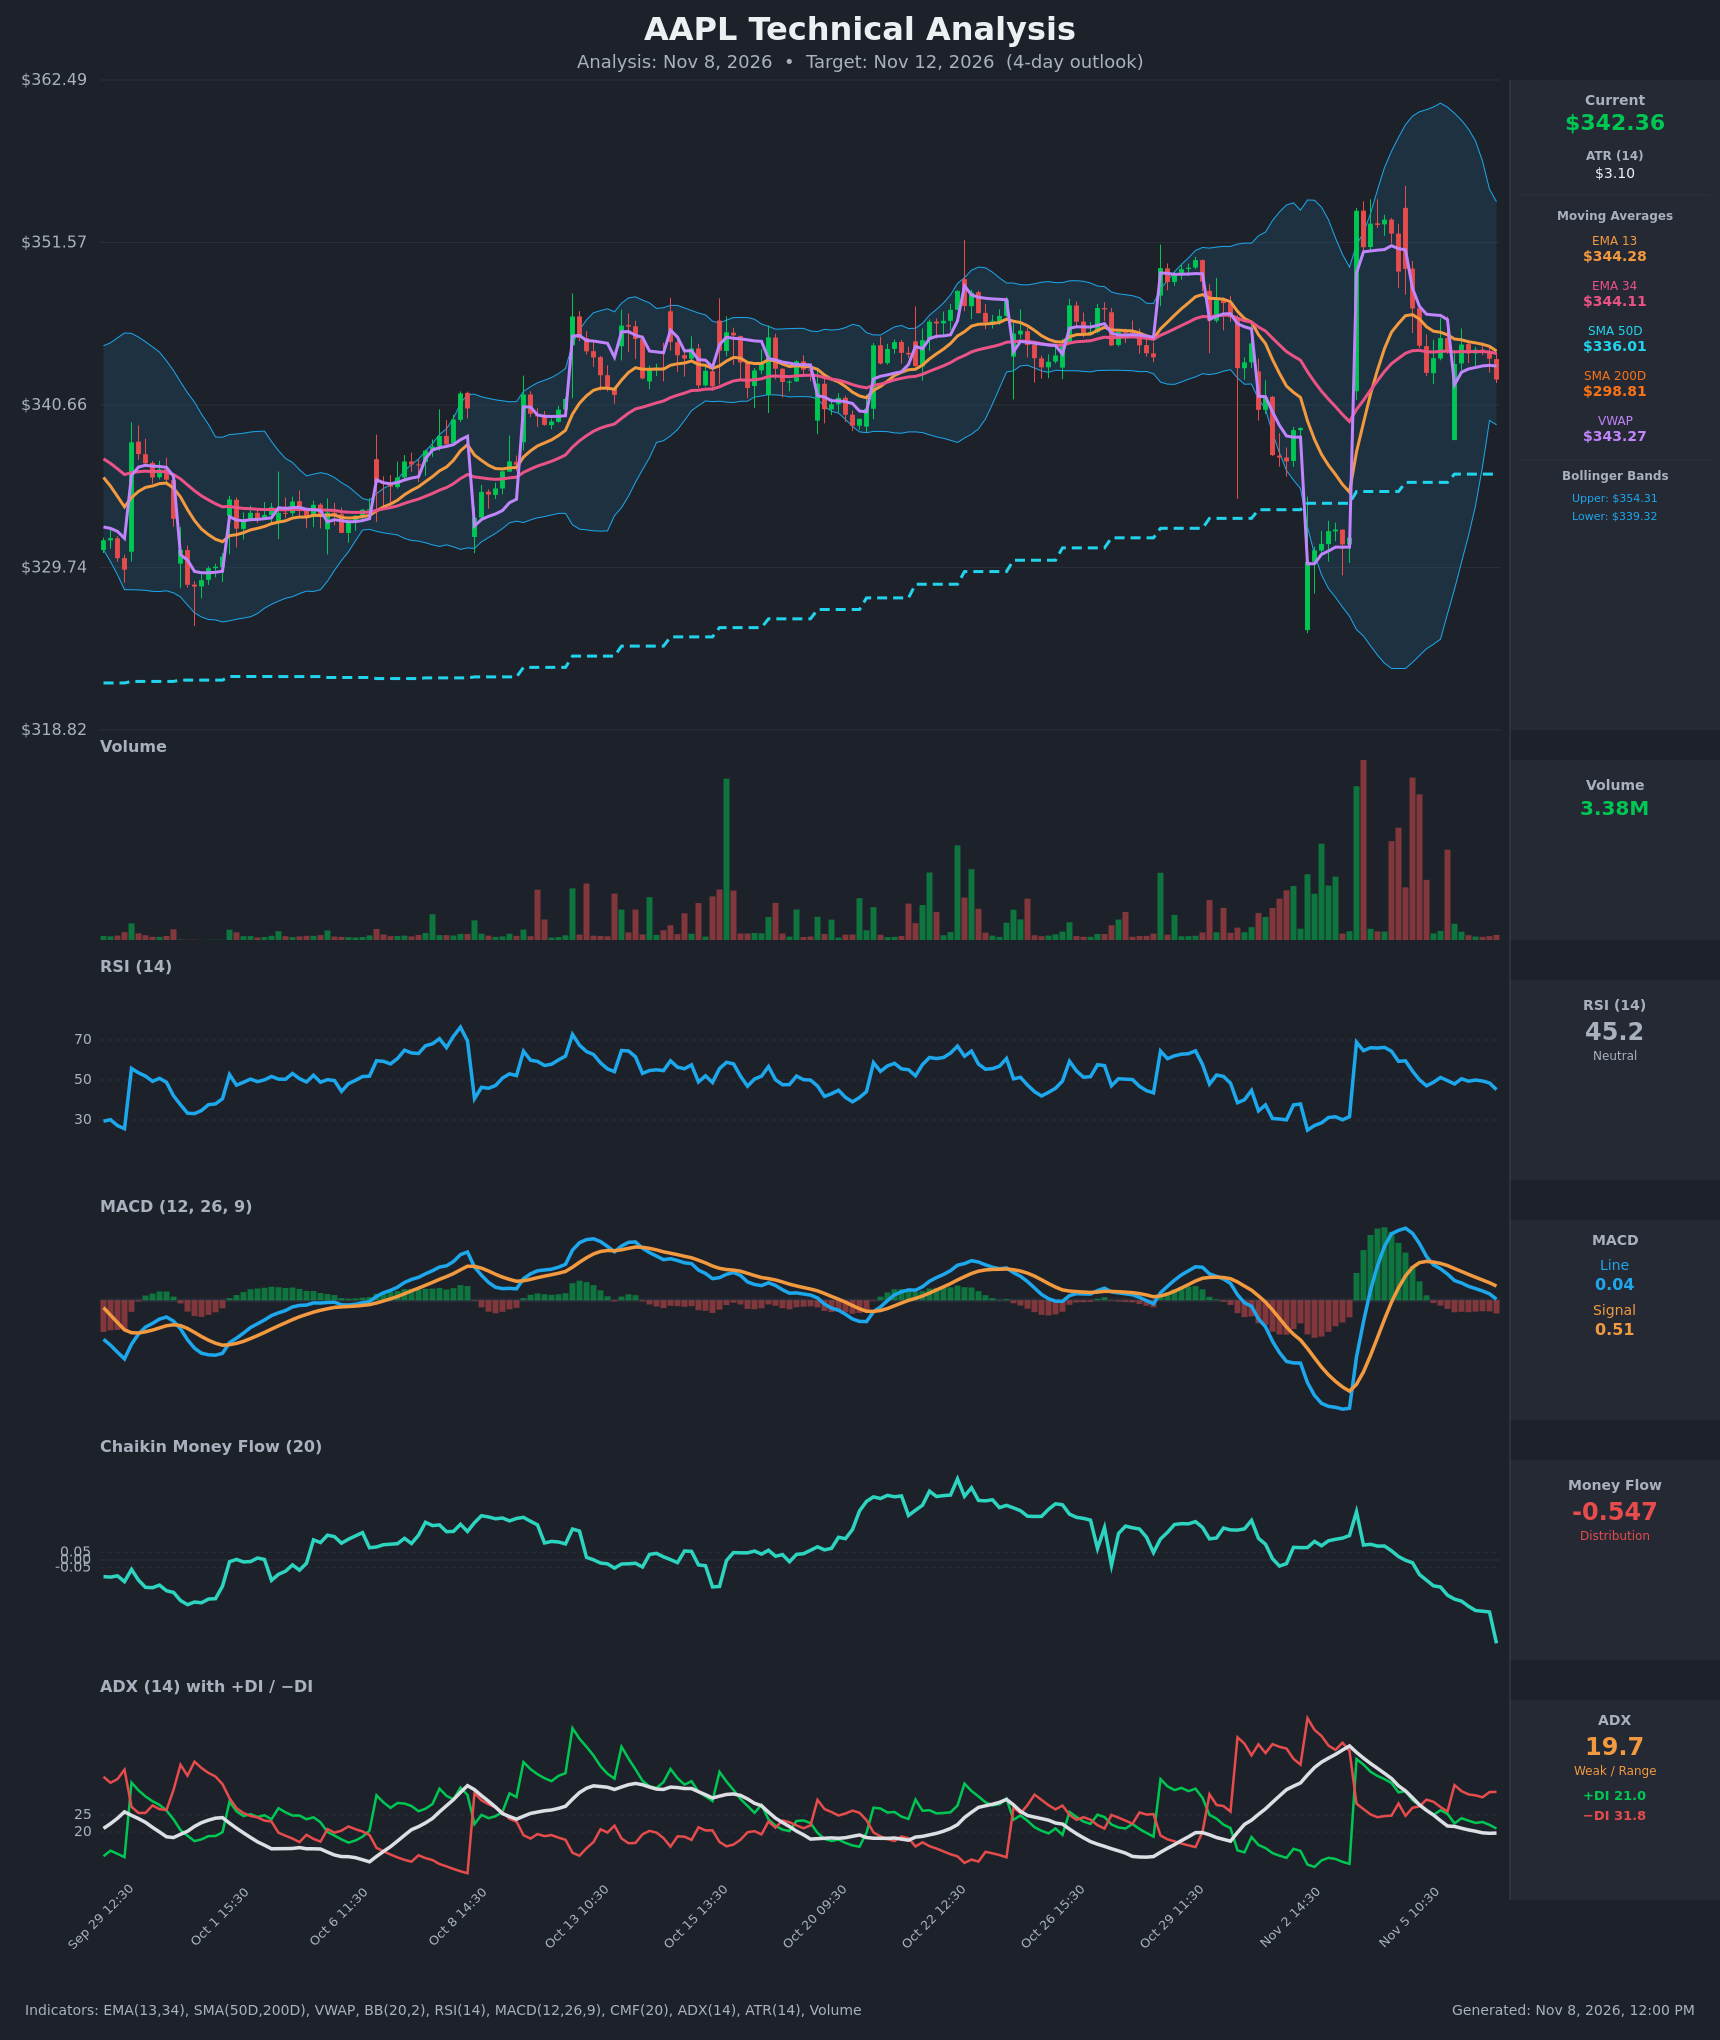
- RSI (14): 45.2, down from about 50 and from 59-60 on Nov 4-5. It is below the 50 midline and drifting lower, but nowhere near oversold. [Bearish]
- 20 EMA: The data provides EMA 13 ($344.28) and EMA 34 ($344.11) instead. Price at $342.37 is below both, which makes them resistance. The two EMAs are almost flat and nearly converged (EMA13 is only about $0.17 above EMA34), so the trend is stalling. [Bearish]
- MACD: Line at 0.036, signal at 0.505, histogram about -0.47. The line crossed below the signal around Nov 5 12:30-13:30 and the gap is widening, with the line about to touch zero. [Bearish]
- Bollinger Bands (20): Upper $354.31, lower $339.32, so price sits in the lower third. The bands are still wide from the earlier spike but are starting to contract. The lower band is only about $3 (one ATR) below price, so a bounce or a squeeze toward it is plausible. [Neutral]
- CMF (20): -0.547, a sharp drop from -0.34 in the previous bar and well below the -0.05 threshold. The chart shows it falling steadily for several sessions, which points to heavy distribution. [Distribution]
- ADX (14): 19.7 and falling from 33.6, so the trend is weak or range-bound. −DI (31.8) is above +DI (21.0), so sellers have the edge, but the low ADX limits conviction. [Weak Trend, Bearish lean]
- Volume: 3.38M on the latest bar, which is quiet compared with the big spikes around Nov 2-4. The current pullback is happening on fading volume, so it is orderly rather than panicked. [Neutral / mild lack of conviction]
DIVERGENCES & TRENDS
- There is no clear divergence. RSI, MACD, CMF and the DI lines all confirm the recent price weakness.
- Momentum has been fading since the Nov 4-5 peak: MACD went from 2.56 to 0.04, RSI from 59.6 to 45.2, and +DI from 32 to 21.
- Price is below VWAP ($343.27) and both EMAs, which are now acting as resistance.
- The structure is still above the SMA50D ($336.01) and far above the SMA200D ($298.81), so the longer-term uptrend is intact. The SMA50D is rising and well above the SMA200D, which is a standing bullish alignment (no death cross).
- CMF at -0.55 is the most extreme reading on the panel. It is the clearest warning, though it could mean-revert after a washout.
- ADX is falling under 20, so a drift or consolidation is more likely than an impulsive selloff.
CHART PATTERNS
- Price is consolidating in a tight band of about $342-346 after the gap-up spike to about $354 and the retracement from it. This resembles a Bullish Flag/Pennant (continuation) in shape, but the indicators (negative CMF, −DI dominance, bearish MACD cross) do not support a breakout up.
- The lower highs since Nov 4, converging with a flat floor near $342, are closer to a Descending/Symmetrical Triangle with a downside bias. A break below about $341-342 targets the lower Bollinger Band ($339.3), then the SMA50D ($336.0).
- A rise back above the EMAs and VWAP (about $344.3-346) would invalidate the bearish read.
POTENTIAL SCENARIOS
- Scenario 1: Bearish Drift to Lower Band / SMA50D Zone — Distribution (CMF -0.55), a bearish MACD cross and −DI dominance push price through the $342 floor toward the lower Bollinger Band. Trigger: hourly close below $341.50. Target: $339.50, with an extension to $336.00. Invalidation: close above $344.30 (EMA13/VWAP area). (50% probability)
- Scenario 2: Neutral Range Chop — ADX under 20 and fading volume keep price between the lower band and the EMAs. Trigger: price holds $339.50-$345 with no volume expansion. Target: $341-$344. Invalidation: a close outside $339 or $346. (27% probability)
- Scenario 3: Bullish Relief Bounce — An oversold-ish CMF and support near the lower band spark a bounce back through the EMAs. Trigger: reclaim of $344.30 with rising volume. Target: $347-$349. Invalidation: close back below $341. (23% probability)
PRICE TARGETS
- Target Price: $339.50 (4-day horizon)
- Expected Range: $334.50 to $348.50. Width is $14.00, about 4.1% of the current price, which fits a 4-day window (wider than a 2-3 day range, narrower than a 7-10 day range).
- Key Levels: Support at $336.01 (SMA50D; the lower BB at $339.32 is the first minor support). Resistance at $344.28 (EMA13, with VWAP at $343.27 just below it).
OVERALL BIAS
OVERALL BIAS: BEARISH - Price is below the EMAs and VWAP, MACD has crossed down, −DI leads +DI, and CMF at -0.55 shows heavy distribution, so a drift toward the lower Bollinger Band and possibly the SMA50D is the most likely path. The low ADX and the rising SMA50D limit downside conviction, so the move is likely modest.
This is educational analysis and not financial advice.