AAPL 6-day bearish forecast — Nov 8, 2026
- Bias: Bearish
- Timeframe: 6 days (made Nov 8, 2026, target date Nov 13, 2026)
- Price at analysis: $342.37
- Price target: $339.50
- Expected range: $332.50 – $348.50
- Result: Incorrect (+3.8%) — closed at $355.35 on Nov 13, 2026; quality score 20/100
Get a free AI analysis of AAPL today
Analysis
TECHNICAL INDICATORS
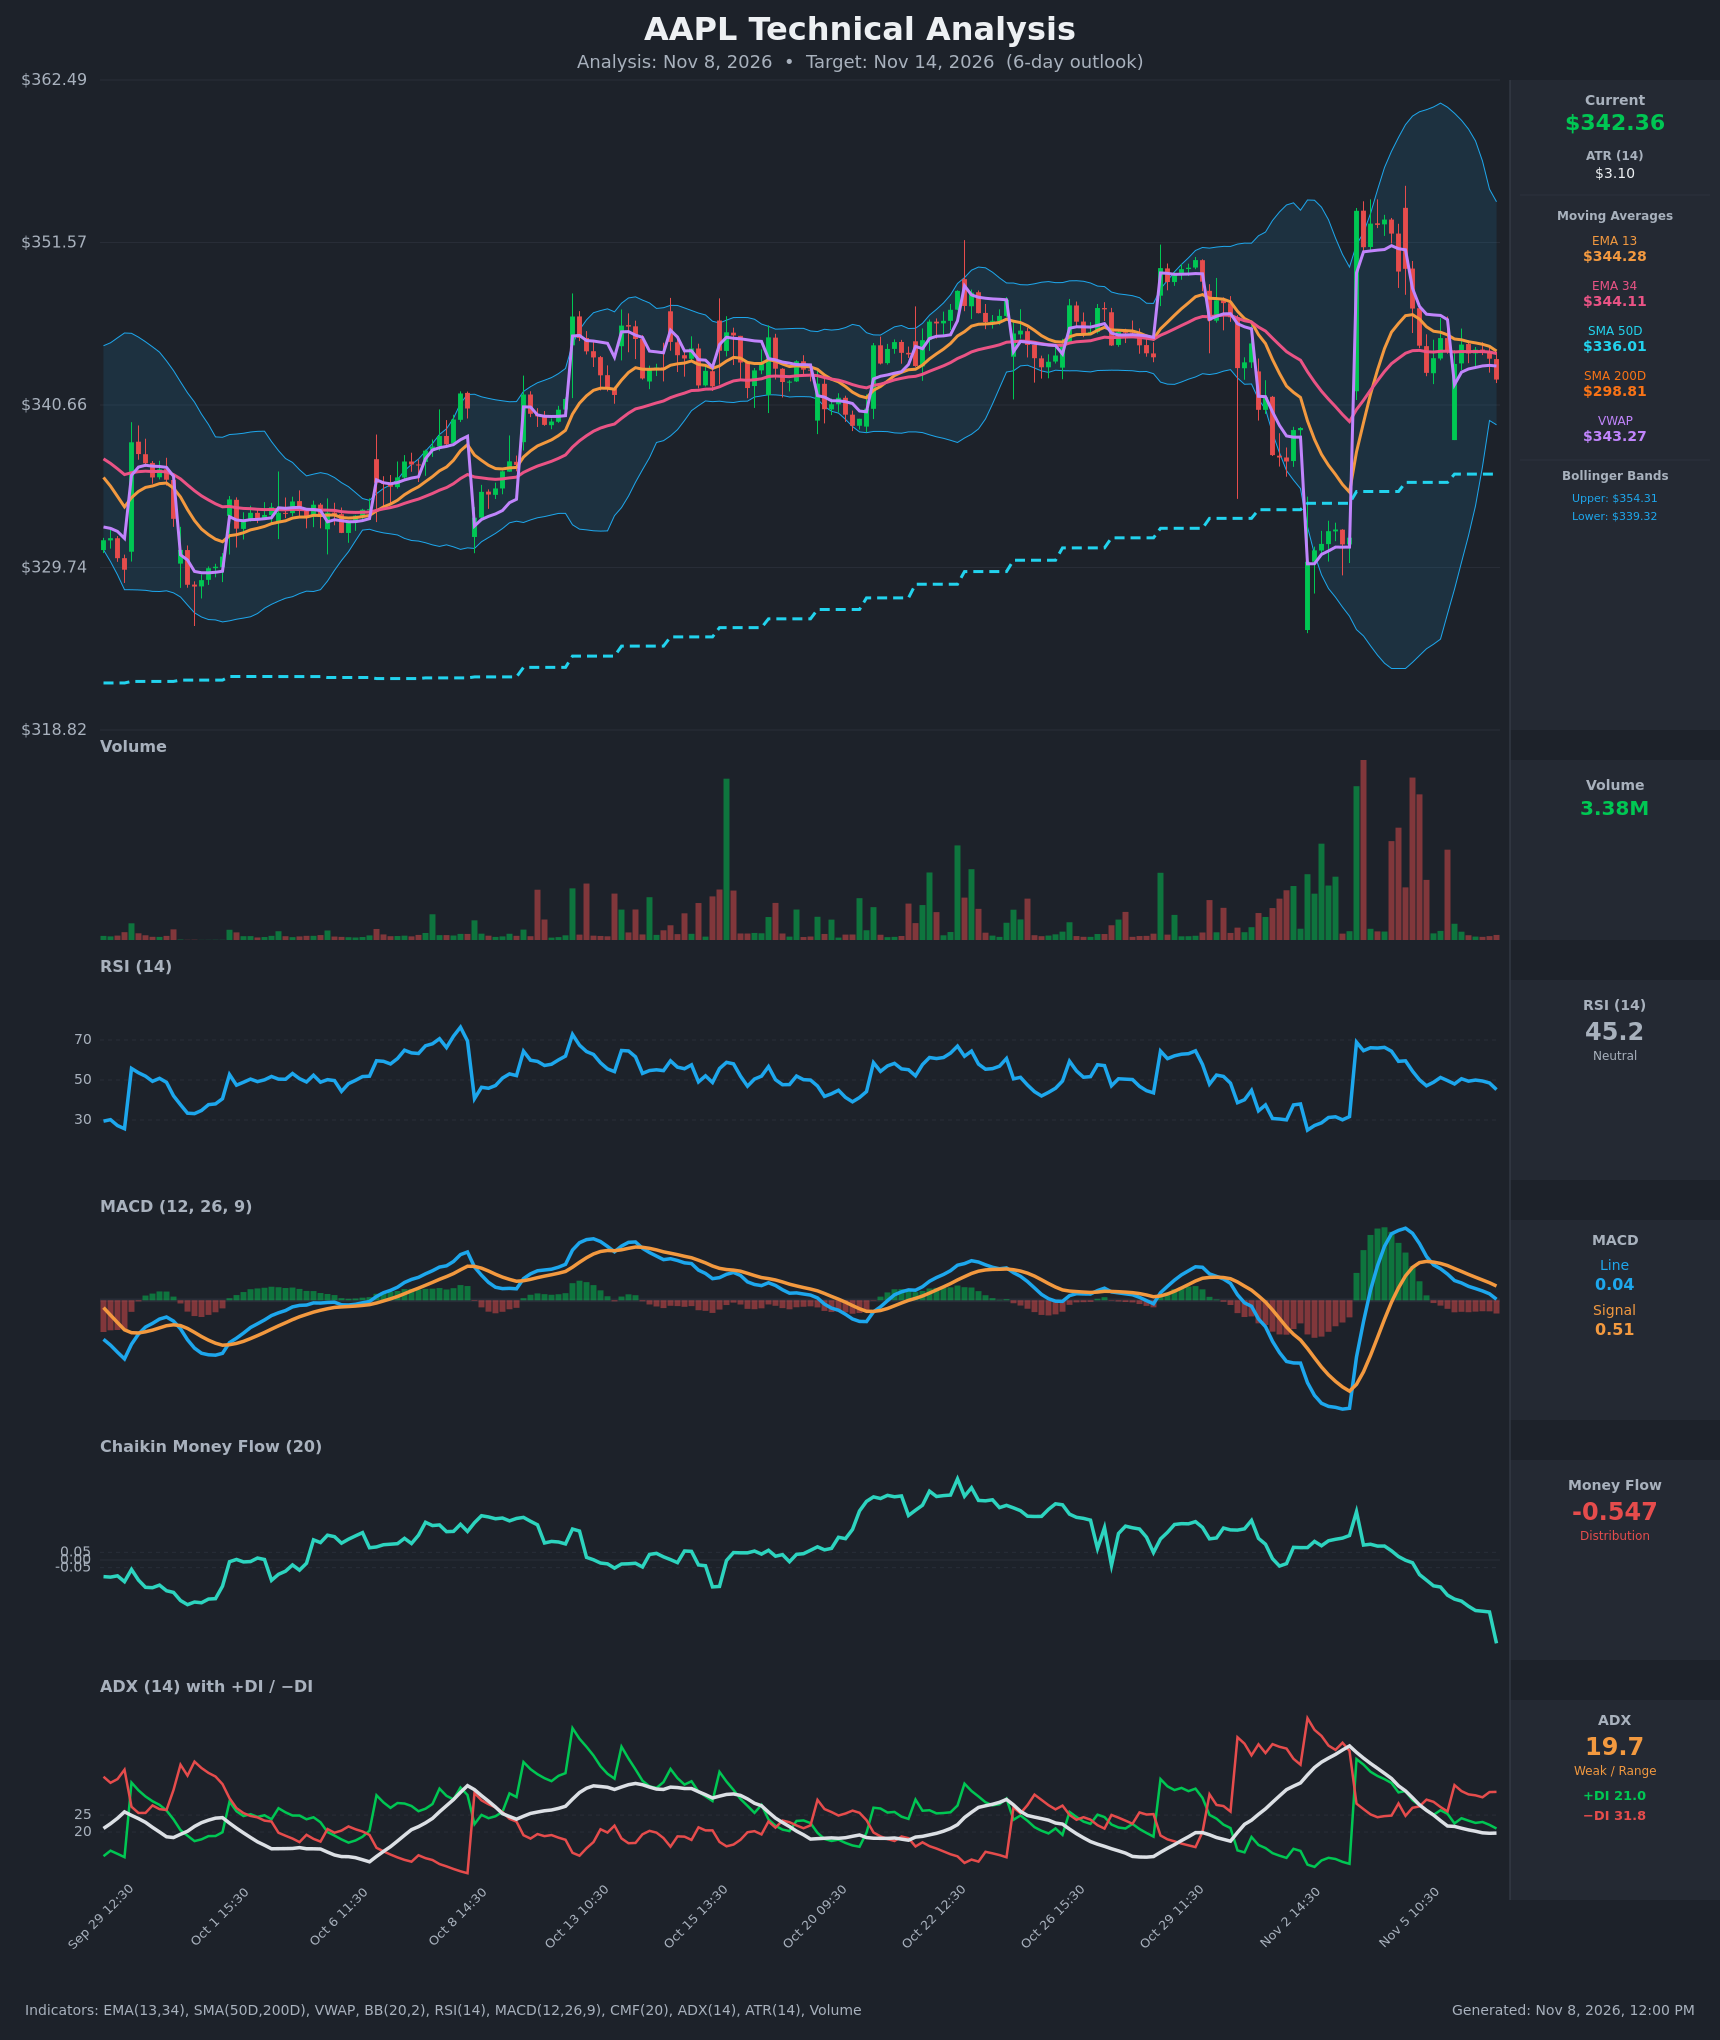
- RSI (14): 45.20, down from about 60 on Nov 4-5 and sitting just under the 50 midline. Momentum is fading but far from oversold (30). [Bearish]
- 20 EMA: The data provides EMA 13 ($344.28) and EMA 34 ($344.11), used here as the short-term average proxy. Price at $342.37 is below both, and EMA 13 has just crossed back under EMA 34 after being above it. The cluster near $344.1-344.3 is now overhead resistance. [Bearish]
- MACD: The line (0.036) is below the signal (0.505) and has been under it since about Nov 5 12:30. The histogram is negative and widening, and the line is about to cross the zero line downward. [Bearish]
- Bollinger Bands (20): Upper $354.31, lower $339.32, midline about $346.8. Price is in the lower third of the bands and about $3 above the lower band. The bands are still wide from the Nov 3-4 volatility spike but are starting to contract. A test of the lower band is plausible. [Bearish]
- CMF (20): -0.547, a sharp drop from about -0.34 in a single bar and well below the -0.05 threshold. It has been falling steadily since late October, which signals heavy distribution. [Distribution]
- ADX (14): 19.7 and falling, so the trend is weak and range-bound. −DI (31.8) is well above +DI (21.0), so sellers hold the slight directional edge. [Weak Trend, Bearish lean]
- Volume: 3.38M, light compared with the heavy spike bars around Nov 3-4. Volume has dried up during the pullback, so there is no panic selling. The distribution in CMF suggests sellers still have the upper hand on down bars. [Neutral to Mildly Bearish]
Longer-term structure remains constructive. Price is above SMA50 ($336.01) and well above SMA200 ($298.81), and the golden cross is long established. Price is also slightly below VWAP ($343.27), which shows mild selling pressure.
DIVERGENCES & TRENDS
- No clear divergence is present. RSI, MACD and CMF are all making lower readings along with price, which confirms the weakness.
- CMF is the standout, with a steep deterioration to -0.547 even though price has only drifted lower. This is a warning of distribution that price has not yet fully reflected.
- The EMA 13/34 crossover has turned bearish (344.28 vs 344.11, essentially flat but rolling over). The MACD bearish crossover is already in place.
- The DI lines show −DI dominant, but ADX below 20 means the downtrend lacks conviction.
- The SMA50 and SMA200 are both rising, so the long-term trend is intact.
CHART PATTERNS
- Descending channel after a spike (bullish flag-like): After the Nov 3 gap up to about $350, price has made lower highs and lower lows in a drifting channel. On the reference diagram this resembles a Bullish Flag, but the flag is not confirmed. CMF and MACD contradict it, and a flag needs a breakout above the channel top (about $345-346).
- Possible Bearish Double Top: The highs near $350-351 on Nov 3-4 form a loose double top. The neckline is near $340-342, close to the current price and the lower Bollinger Band. A break below ~$339 would target roughly $329-331, the measured move and the Oct 30 low area, though my 6-day target is more conservative.
- Overall, the picture is a range-bound consolidation with a downward lean.
POTENTIAL SCENARIOS
- Scenario 1: Bearish Drift to the Lower Band and SMA50 — Distribution (CMF -0.547), the bearish MACD cross and −DI dominance push price through the lower Bollinger Band area. Trigger: hourly close below $339.30. Target: $336-339.5, with a deeper test of the SMA50 near $336. Invalidation: close back above $344.30 (EMA cluster) with CMF turning up. (50% probability)
- Scenario 2: Neutral Range Chop — ADX below 20 keeps price oscillating between the lower band and EMA resistance. Trigger: failure to break $339.3 or $344.3 decisively. Target: $340-345. Invalidation: a decisive hourly close outside the $339-346 range. (28% probability)
- Scenario 3: Bullish Flag Breakout — Buyers defend the $339-340 zone, and the flag resolves upward on a rebound in volume. Trigger: close above $346 (descending channel top and EMA 13/34 area). Target: $350-352, the prior highs. Invalidation: loss of $339.30. (22% probability)
PRICE TARGETS
- Target Price: $339.50 (6-day horizon)
- Expected Range: $332.50 to $348.50. The width is $16.00, about 4.7% of the current price, which fits a 6-day timeframe (between the 2-3 day and 7-10 day guidance).
- Key Levels: Support at $339.32 (lower Bollinger Band), then $336.01 (SMA50). Resistance at $344.28 (EMA 13 / EMA 34 cluster), then $346.80 (BB midline).
OVERALL BIAS
OVERALL BIAS: BEARISH - CMF at -0.547 shows heavy distribution, MACD is below its signal, −DI dominates +DI, and price sits below the short EMAs and VWAP. The long-term uptrend above SMA50/SMA200 and weak ADX limit the downside, so the expected move is a drift toward the lower band and SMA50 area rather than a collapse.
This is educational analysis and not financial advice.