AAL 6-day bullish forecast — Nov 8, 2026
- Bias: Bullish
- Timeframe: 6 days (made Nov 8, 2026, target date Nov 13, 2026)
- Price at analysis: $13.16
- Price target: $13.33
- Expected range: $12.80 – $13.60
- Result: Correct (0.0%) — closed at $13.17 on Nov 13, 2026; quality score 100/100
Get a free AI analysis of AAL today
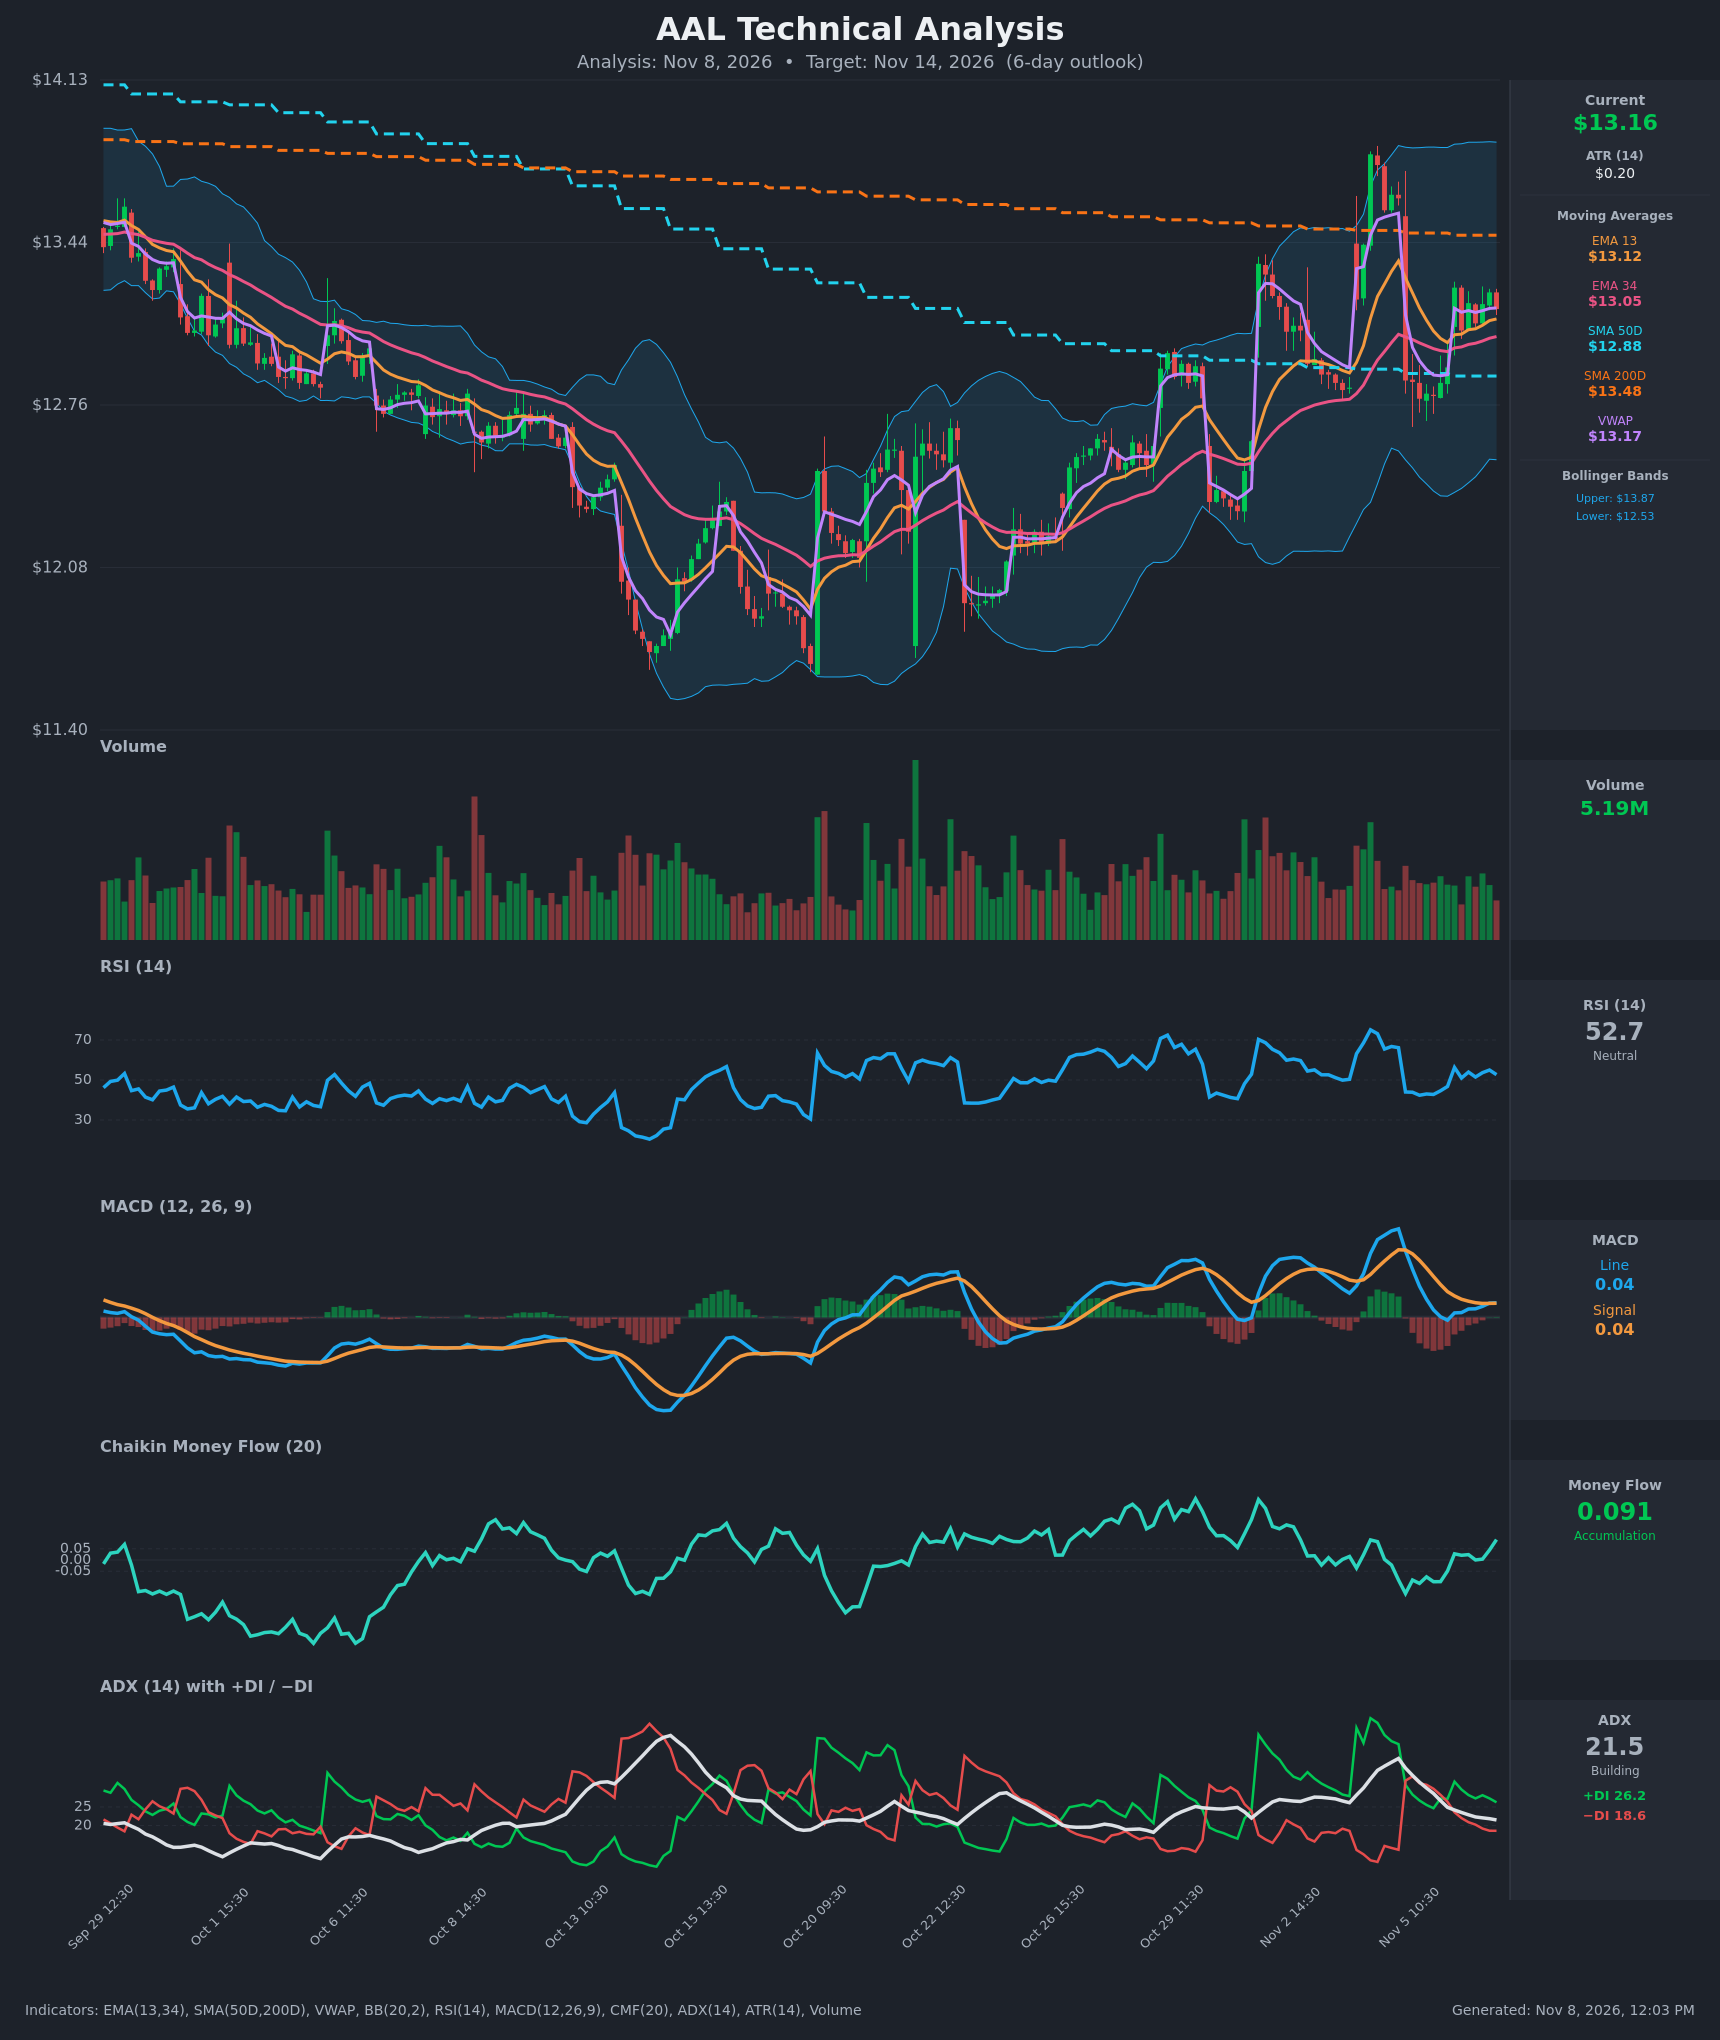
Analysis
TECHNICAL INDICATORS
- RSI (14): 52.68, right at the midline after swinging between 42 and 56 over the last day and a half. It has recovered from 42.4 on Nov 5, so momentum is mildly improving but not decisive. [Neutral]
- 20 EMA: The chart uses EMA 13 ($13.12) and EMA 34 ($13.05). Price at $13.165 is above both, and EMA13 is above EMA34, so the short-term trend is up. The EMAs act as support at $13.05-$13.12. [Bullish]
- MACD: Line 0.0395 vs signal 0.0382, so it is just barely above the signal. It has been rebuilding from -0.007 and the histogram is flat to slightly positive. The line has been converging with the signal, so the cross is marginal and fragile. [Neutral]
- Bollinger Bands (20): Upper $13.87, lower $12.53, midline about $13.20. Price sits near the midline and the bands are wide after the volatile spike to about $13.95 and the drop. There is no squeeze or band-walk, so mean-reverting chop is likely. [Neutral]
- CMF (20): 0.091, up from negative readings (-0.149 on Nov 5) and above the +0.05 accumulation threshold. Buying pressure is improving. [Accumulation]
- ADX (14): 21.5 and falling from 38. +DI (26.2) is above −DI (18.6), so bulls are in control. The trend is weak, though, and not yet established. [Weak Trend, Bullish lean]
- Volume: 5.19M, average to below average, with no volume surge in the recent bounce. The Nov 5 selloff was met by quiet buying. [Neutral]
DIVERGENCES & TRENDS
- There is no clear price/RSI divergence. RSI peaked near 70 at the Nov 3-4 spike and has since reset to the midline, a healthy cool-off.
- CMF is turning up from distribution to accumulation while price makes higher intraday lows around $12.80 and $13.07. This is a mild bullish confirmation.
- ADX has fallen from 38 to 21.5, so the strong impulse of the Nov 4 spike and drop has faded into consolidation. +DI re-crossed above −DI on Nov 6.
- The EMA13/EMA34 stack is bullish (13.12 over 13.05).
- Price is above SMA50 ($12.88) but below SMA200 ($13.48). SMA50 is below SMA200, so there is no golden cross and the long-term picture is still a recovery under the 200-day.
- MACD is hugging its signal line, so a bearish re-cross is possible if price slips.
CHART PATTERNS
- Bullish Double Bottom (reversal): The larger structure shows lows near $11.6-$11.8 in mid-October, followed by a recovery above the neckline around $12.9-$13.0. The pattern has largely played out, and price is now testing the next hurdle, SMA200 at $13.48.
- Ascending Triangle / bullish flag-like consolidation (continuation, loose fit): Recent action shows higher lows ($12.80 to $13.07) under a ceiling near $13.25-$13.30. A break above $13.30 would target roughly $13.50-$13.60.
- The wide spike to about $13.95 followed by rejection marks upper resistance. The 13.48 SMA200 and the $13.87 upper band cap upside in this window.
POTENTIAL SCENARIOS
- Scenario 1: Bullish Grind Toward SMA200 — Higher lows hold above the EMA stack, CMF stays in accumulation and +DI stays above −DI, pushing price through the $13.30 ceiling toward the 200-day. Trigger: hourly close above $13.30 with a MACD cross higher. Target: $13.45-$13.60. Invalidation: close below $13.05 (EMA34). (50% probability)
- Scenario 2: Neutral Range Chop — Weak ADX keeps price between the EMAs and the $13.30 ceiling, mean-reverting around the VWAP and midline. Trigger: failure at $13.30 and support at $13.05. Target: $13.00-$13.30. Invalidation: a decisive close outside $12.90-$13.45. (28% probability)
- Scenario 3: Bearish Rejection — Price stalls under the 200-day, MACD crosses down, and price loses the EMAs and revisits the Nov 5 low. Trigger: close below $13.05, then $12.88 (SMA50). Target: $12.80-$12.88. Invalidation: reclaim of $13.30. (22% probability)
PRICE TARGETS
- Target Price: $13.33 (6-day horizon, about +1.3%)
- Expected Range: $12.80 to $13.60. The $0.80 width is about 6.1% of the current price, in line with the 4-8% guideline for a 6-10 day window, and is roughly 3.9 ATR.
- Key Levels: Support at $13.05, Resistance at $13.48
OVERALL BIAS
OVERALL BIAS: BULLISH - Price is above the rising EMA13/EMA34 and SMA50, +DI leads −DI, and CMF has turned into accumulation. The upside is capped by the $13.48 SMA200, so conviction is modest.
This is educational analysis and not financial advice.