AAL 4-day bullish forecast — Nov 8, 2026
- Bias: Bullish
- Timeframe: 4 days (made Nov 8, 2026, target date Nov 11, 2026)
- Price at analysis: $13.16
- Price target: $13.30
- Expected range: $12.90 – $13.50
- Result: Correct (+6.9%) — closed at $14.07 on Nov 11, 2026; quality score 51/100
Get a free AI analysis of AAL today
Analysis
TECHNICAL INDICATORS
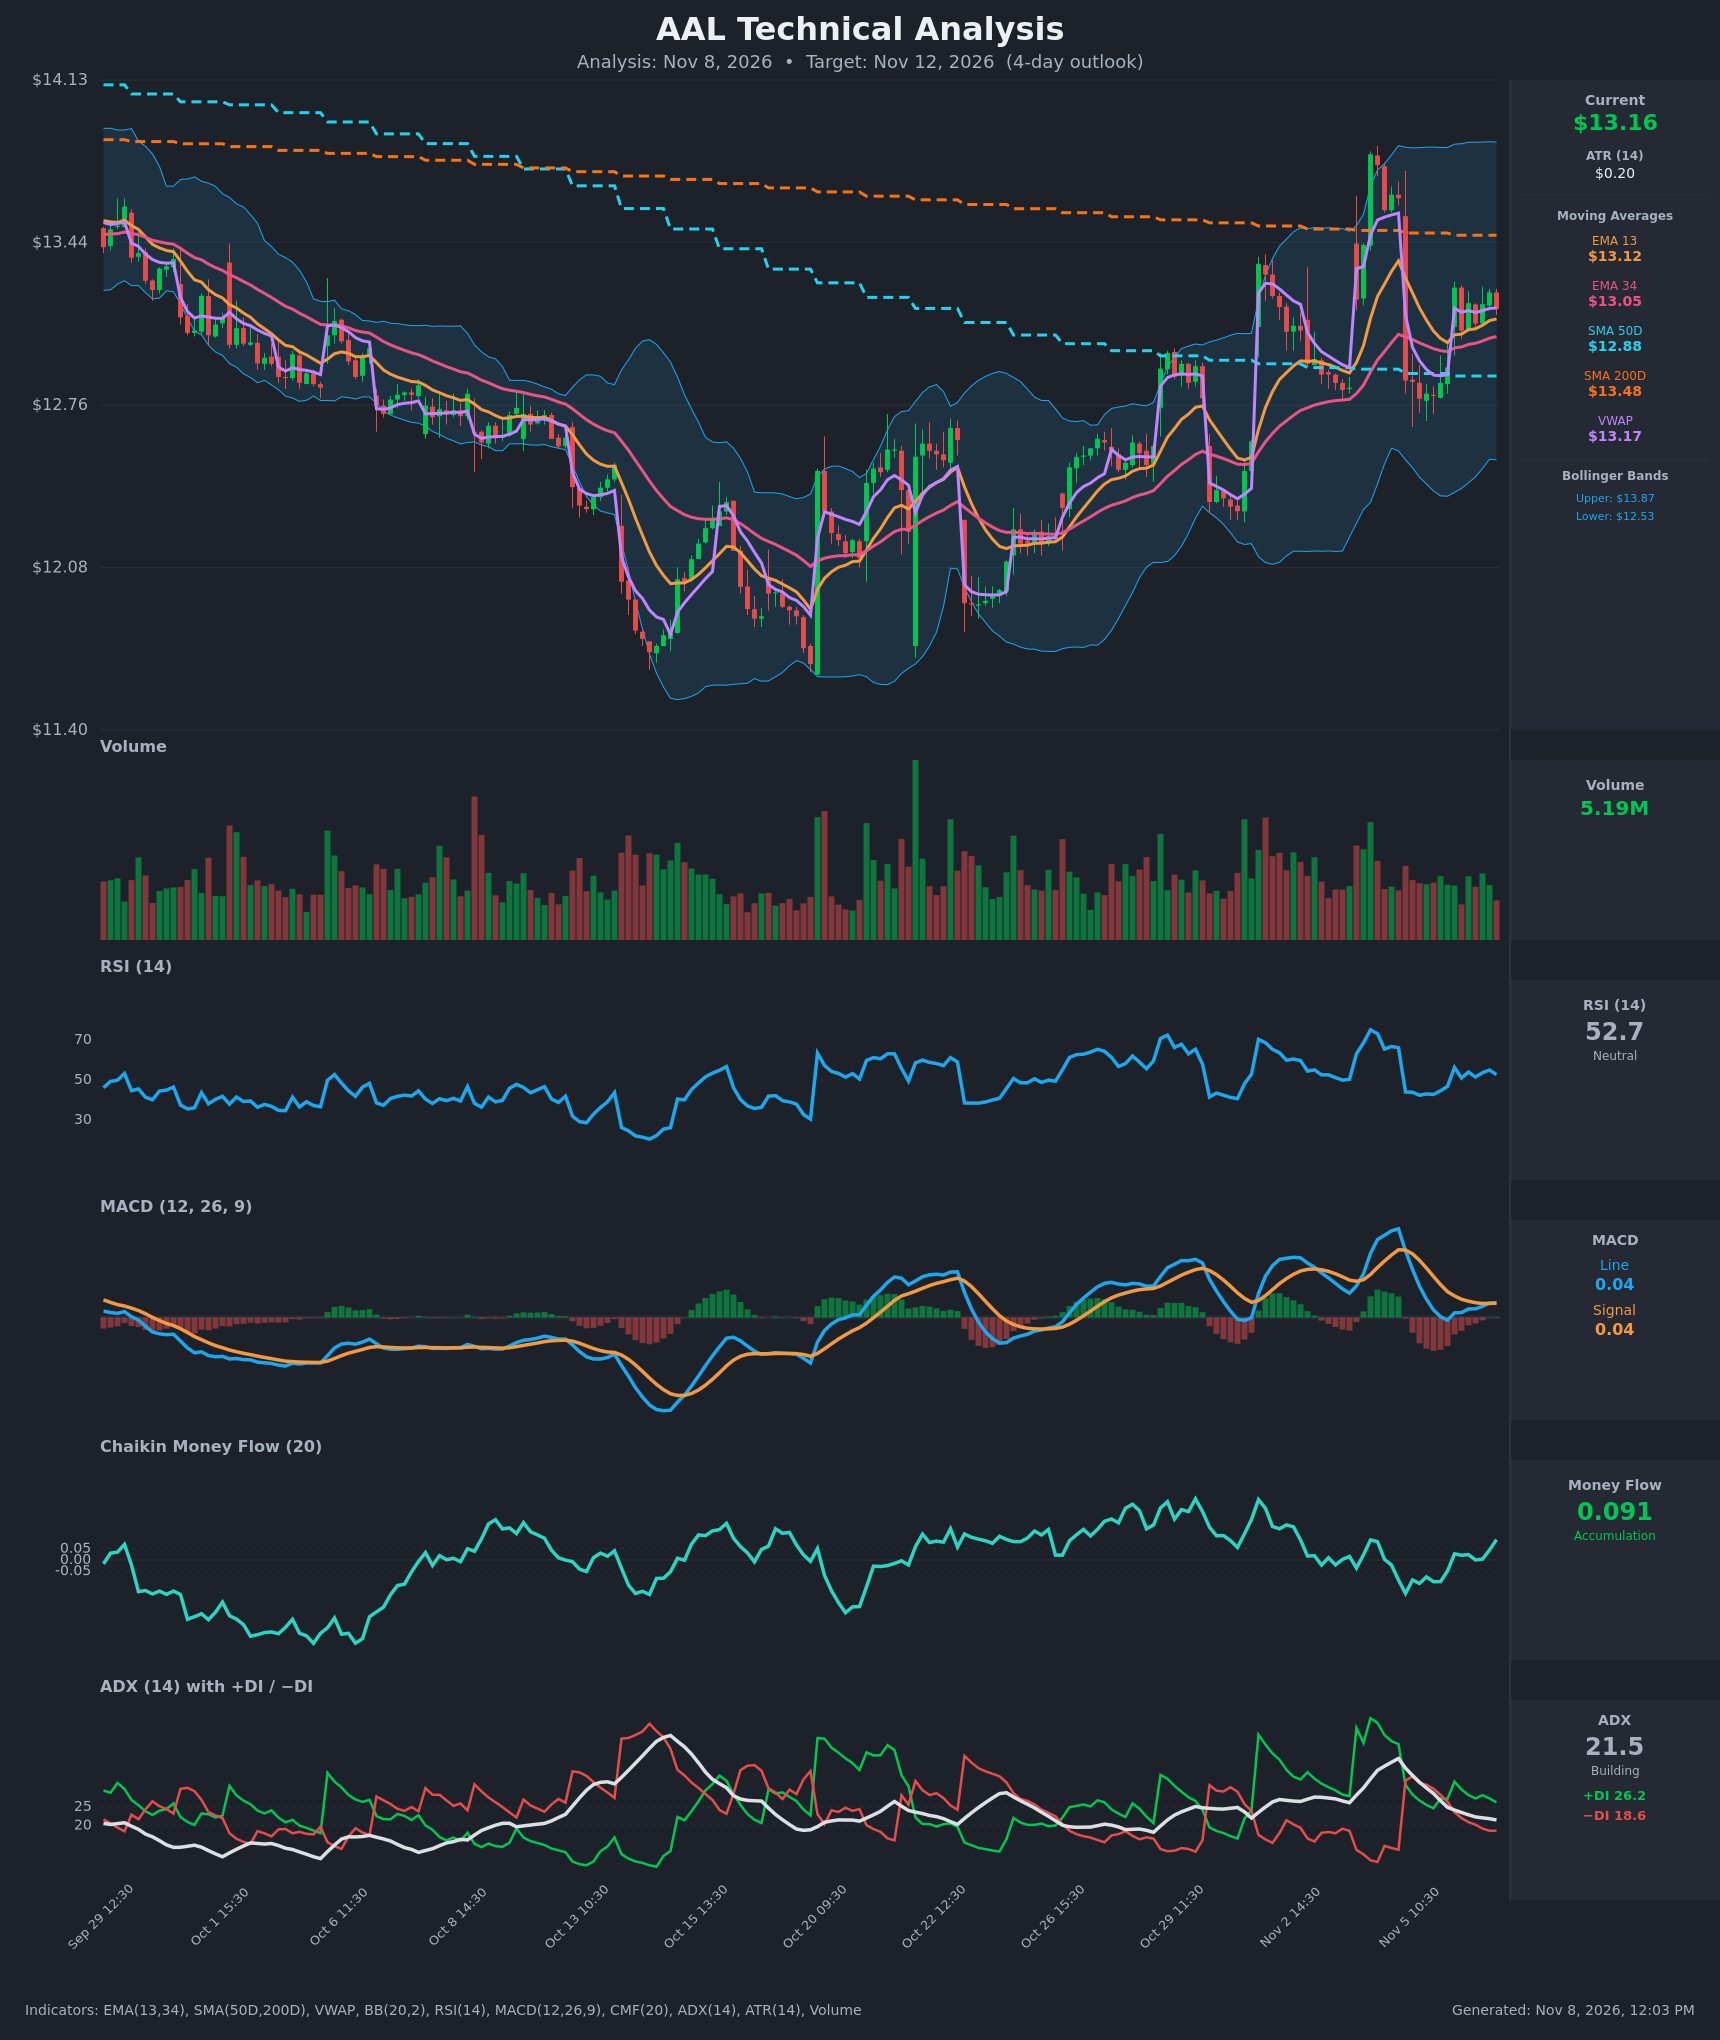
- RSI (14): 52.68, right at the midline after swinging between 44 and 56 over the last day. It is recovering from the 42-44 area on Nov 5 but has not pushed into bullish territory (>60). Momentum is flat to slightly positive. [Neutral]
- 20 EMA (EMA 13 / EMA 34 used): EMA 13 is $13.12 and EMA 34 is $13.05. Price at $13.165 sits above both, and EMA 13 is above EMA 34 with a small spread, so the short-term trend is up. The $13.12 / $13.05 zone is first support. [Bullish]
- MACD: The line (0.0395) has just crossed back above the signal (0.0382). The histogram is barely positive after a drop from 0.238 on Nov 4. Momentum has stabilized, but the crossover is weak and sits near the zero line. [Neutral]
- Bollinger Bands (20): Upper is $13.87, lower is $12.53, and the middle is about $13.20. Price is hugging the midline. The bands are still wide from the Nov 4 spike but are starting to contract. This points to consolidation with room to move either way. [Neutral]
- CMF (20): 0.091, above the +0.05 threshold and turning up from -0.149 on Nov 5. It has been positive for the last 7 bars, which suggests modest accumulation on the bounce. [Accumulation]
- ADX (14): 21.5 and falling from 38. This is a weak trend that is close to range-bound. +DI (26.2) is above −DI (18.6), so bulls have the edge, but the trend has little strength. [Weak Trend, bullish lean]
- Volume: 5.19M, below the spikes seen on the Nov 4-5 swing and roughly average to slightly light on the recent bars. The bounce has no strong volume confirmation yet. [Neutral / mildly supportive]
DIVERGENCES & TRENDS
- There is no clear price/RSI divergence. The Nov 4 spike to about $13.9 made a high RSI reading near 70, and the pullback reset RSI to the 50 area, which is a healthy cooldown.
- The Oct 20 low (~$11.7) to now is a sequence of higher lows ($12.0, $12.55, $12.75). That is a constructive intermediate uptrend.
- Trend behavior:
- EMA 13 is above EMA 34 and price is above SMA50 ($12.88), so the short and medium trend is up.
- Price is still below SMA200 ($13.48), which is long-term resistance.
- SMA50 remains below SMA200 (no golden cross), so the long-term backdrop is not yet confirmed bullish.
- Crossovers:
- MACD just crossed back above its signal, which is marginally bullish.
- +DI regained the lead over −DI after the Nov 5 DI crossover, which is bullish.
- Price is trading right on VWAP ($13.17), so it is neutral intraday.
- ADX is falling, so the move is fading into consolidation. Expect modest moves rather than a breakout.
CHART PATTERNS
- Consolidation after a spike (bullish flag / pennant-like): Price spiked to ~$13.9 on Nov 4, pulled back to ~$12.8, and has recovered into a tightening range of $12.8-$13.3. This loosely resembles the Bullish Pennant/Flag from the reference diagram, but it is not a clean textbook match.
- Ascending-triangle lean: The higher lows since Oct 20 against overhead resistance at $13.30-$13.48 (the Nov 6 highs and SMA200) loosely resemble an Ascending Triangle. A close above $13.48 would target the $13.85-$13.90 prior high, a measured move of about $0.40-$0.70.
- The patterns are not fully developed, so confidence is modest. The 4-day horizon is likely too short for a full measured move.
POTENTIAL SCENARIOS
- Scenario 1: Bullish Grind Toward SMA200 — Price holds the EMA 13 / EMA 34 cluster, and accumulation (CMF >0.05) with +DI dominance carries it toward the $13.30-$13.45 area. Trigger: hold above $13.05 and a push through the Nov 6 high near $13.30. Target: $13.30-$13.45. Invalidation: a close below $13.00. (50% probability)
- Scenario 2: Neutral Range Chop — ADX is below 22 and falling, and price is pinned at the Bollinger midline and VWAP. Price oscillates between $13.00 and $13.35 with no resolution. Trigger: failure to break either $13.35 or $13.00. Target: $13.10-$13.25. Invalidation: a close outside the $13.00-$13.40 range. (30% probability)
- Scenario 3: Bearish Rejection — SMA200 and the overhead supply cap the rally, MACD rolls back under signal, and price loses the EMAs. Trigger: a close below $13.05 (EMA 34) on rising volume. Target: $12.88 (SMA50), then $12.75. Invalidation: a reclaim of $13.30. (20% probability)
PRICE TARGETS
- Target Price: $13.30 (4-day target)
- Expected Range: $12.90 to $13.50 (width $0.60, about 4.6% of current price, in line with the 4-day guidance)
- Key Levels: Support at $13.05, Resistance at $13.48
OVERALL BIAS
OVERALL BIAS: BULLISH - Price is above EMA 13/34 and SMA50, +DI leads −DI, CMF shows accumulation, and MACD has just turned up. The bias is modest because ADX is weak and SMA200 at $13.48 caps the upside.
This is educational analysis and not financial advice.