NOK 6-day bearish forecast — Nov 8, 2026
- Bias: Bearish
- Timeframe: 6 days (made Nov 8, 2026, target date Nov 13, 2026)
- Price at analysis: $7.66
- Price target: $7.50
- Expected range: $7.05 – $7.95
- Result: Incorrect (+5.4%) — closed at $8.07 on Nov 13, 2026; quality score 7/100
Get a free AI analysis of NOK today
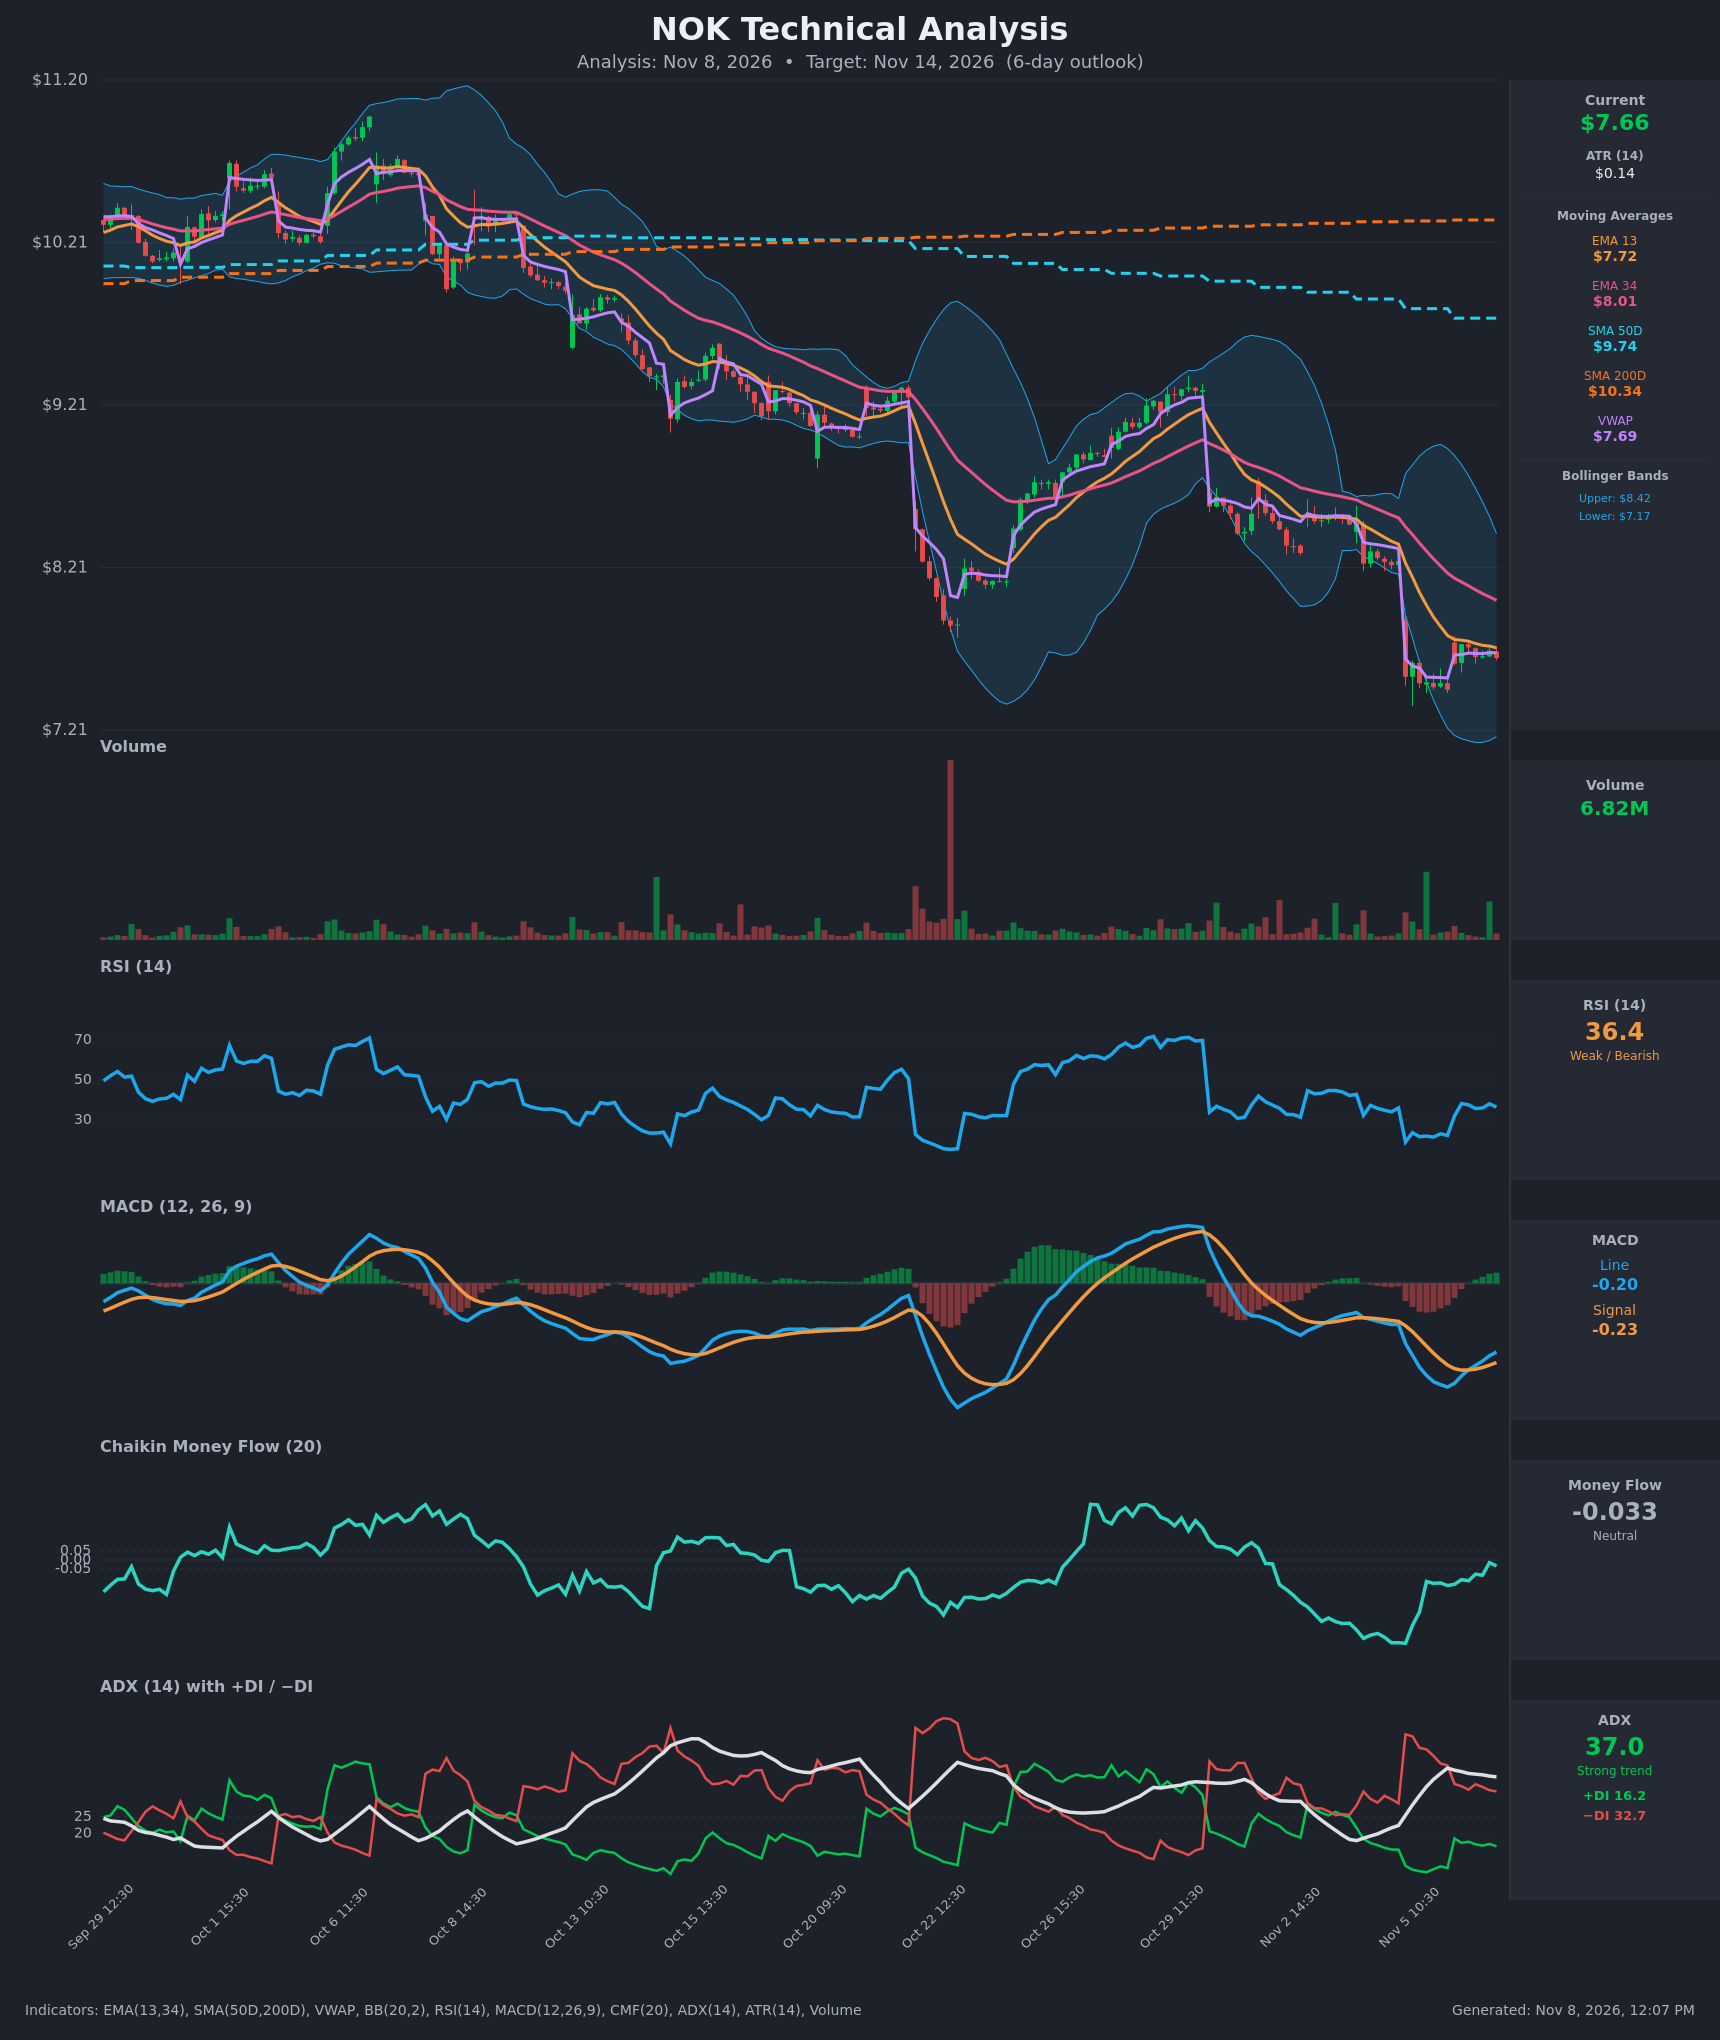
Analysis
TECHNICAL INDICATORS
- RSI (14): 36.45, up from the 19-23 oversold zone on Nov 5 but still below 40 and capped under 50. It is a relief bounce inside a downtrend, not a reversal. [Bearish]
- 20 EMA (EMA 13 / EMA 34 used): EMA 13 is $7.72 and EMA 34 is $8.01. Price of $7.655 sits below both, and EMA 13 is below EMA 34 with a widening gap. EMA 13 is flattening and is the first resistance, at roughly $7.72. [Bearish]
- MACD: Line -0.200, signal -0.231, so the line is above the signal by about +0.03. The histogram has turned slightly positive after a bullish crossover on Nov 6 at 11:30. Both lines are still well below zero, so this is a weak bounce, not a trend change. [Neutral]
- Bollinger Bands (20): Upper $8.42, lower $7.17, midline about $7.80. Price is in the lower half and has rebounded from a lower-band tag (about $7.46 on Nov 5). The bands are wide after the gap-down, so volatility is elevated. The midline near $7.80 and the EMAs are overhead resistance. [Bearish]
- CMF (20): -0.033, inside the neutral band (±0.05) and recovering from -0.45. Selling pressure has faded, and the chart shows CMF curling up from deeply negative levels. [Neutral]
- ADX (14): 37.0 with −DI 32.7 above +DI 16.2. This is a strong trend with bears in control. ADX has eased from 39.7, and the −DI/+DI spread has narrowed from about 40 to about 16, a sign of selling exhaustion. [Strong Trend – Bearish]
- Volume: 6.82M, with a spike on the Nov 5 gap-down and moderate volume on the bounce. The bounce is not showing strong follow-through. Price is slightly below VWAP ($7.687). [Neutral to Bearish]
DIVERGENCES & TRENDS
- Price made a lower low on Nov 5 (about $7.46) and has held a higher low since, while RSI went from 19 to 36. This is a short-term improvement, not a confirmed bullish divergence on the larger trend.
- MACD crossed bullishly below the zero line. Bullish crossovers below zero in a strong downtrend often fail at the zero line or the EMAs.
- EMA 13 is below EMA 34, SMA 50D ($9.74) is below SMA 200D ($10.34) (death cross in place), and price is far below both SMAs. The long-term trend is firmly down.
- ADX above 35 with −DI dominant means the downtrend is mature. The narrowing DI spread suggests a pause or consolidation is more likely than an immediate new leg lower.
- Price has been pinned at $7.62-$7.74 for several sessions, a tight consolidation after the gap-down.
CHART PATTERNS
- Bearish Pennant / small Bearish Flag (continuation): After the sharp drop from about $8.25 to $7.46, price is consolidating in a tight range of about $7.46-$7.74 with lower highs, which matches the bearish pennant in the reference diagram. A break below $7.46 targets roughly the pole length (about $0.80), implying about $6.7, though 6 days is too short to reach all of that.
- Possible base / Double Bottom attempt: The $7.46-$7.50 lows were retested, which could form a minor double bottom. It needs a close above $7.74 to confirm, with a measured move to about $8.0.
- The broader chart is a series of lower highs and lower lows, a staircase decline with gap-downs, which supports continuation more than reversal.
POTENTIAL SCENARIOS
- Scenario 1: Bearish Pennant Breakdown — Price fails at the EMA 13 / VWAP area ($7.72-$7.80) and rolls over, resuming the downtrend with −DI still dominant. Trigger: close below $7.46 (the Nov 5 low), or a rejection at $7.72-$7.80. Target: $7.15-$7.30 (lower Bollinger Band area), with an extension toward $7.00. Invalidation: daily close above $7.85. (50% probability)
- Scenario 2: Neutral Consolidation Drift — Price keeps chopping between $7.45 and $7.80 as the oversold bounce stalls and MACD flattens. Trigger: no break of either boundary. Target: $7.50-$7.75. Invalidation: close outside $7.40-$7.85. (20% probability)
- Scenario 3: Bullish Relief Rally — The MACD crossover and RSI recovery extend, and price reclaims EMA 13 and the BB midline. Trigger: close above $7.80 on rising volume. Target: $8.00-$8.20 (EMA 34 / upper pennant zone). Invalidation: loss of $7.46. (30% probability)
PRICE TARGETS
- Target Price: $7.50 (6-day)
- Expected Range: $7.05 to $7.95 (width $0.90, about 11.8% of the current price; the 6-day guidance is ~4-8% for 7-10 days, but this stock's ATR of $0.14 and the elevated volatility after the gap justify a modestly wider band)
- Key Levels: Support at $7.46 (Nov 5 low), then $7.17 (lower Bollinger Band). Resistance at $7.80 (BB midline / VWAP / EMA 13 zone), then $8.01 (EMA 34).
OVERALL BIAS
OVERALL BIAS: BEARISH - Price is below all the moving averages, with a death cross in place, ADX at 37 and −DI dominant, and a bearish pennant forming after the gap-down. The MACD crossover and RSI bounce are weak relief signals below the zero line and the EMAs.
This is educational analysis and not financial advice.