AMZN 4-day bearish forecast — Nov 8, 2026
- Bias: Bearish
- Timeframe: 4 days (made Nov 8, 2026, target date Nov 11, 2026)
- Price at analysis: $259.35
- Price target: $257.00
- Expected range: $252.50 – $263.00
- Result: Incorrect (+2.6%) — closed at $266.17 on Nov 11, 2026; quality score 26/100
Get a free AI analysis of AMZN today
Analysis
TECHNICAL INDICATORS
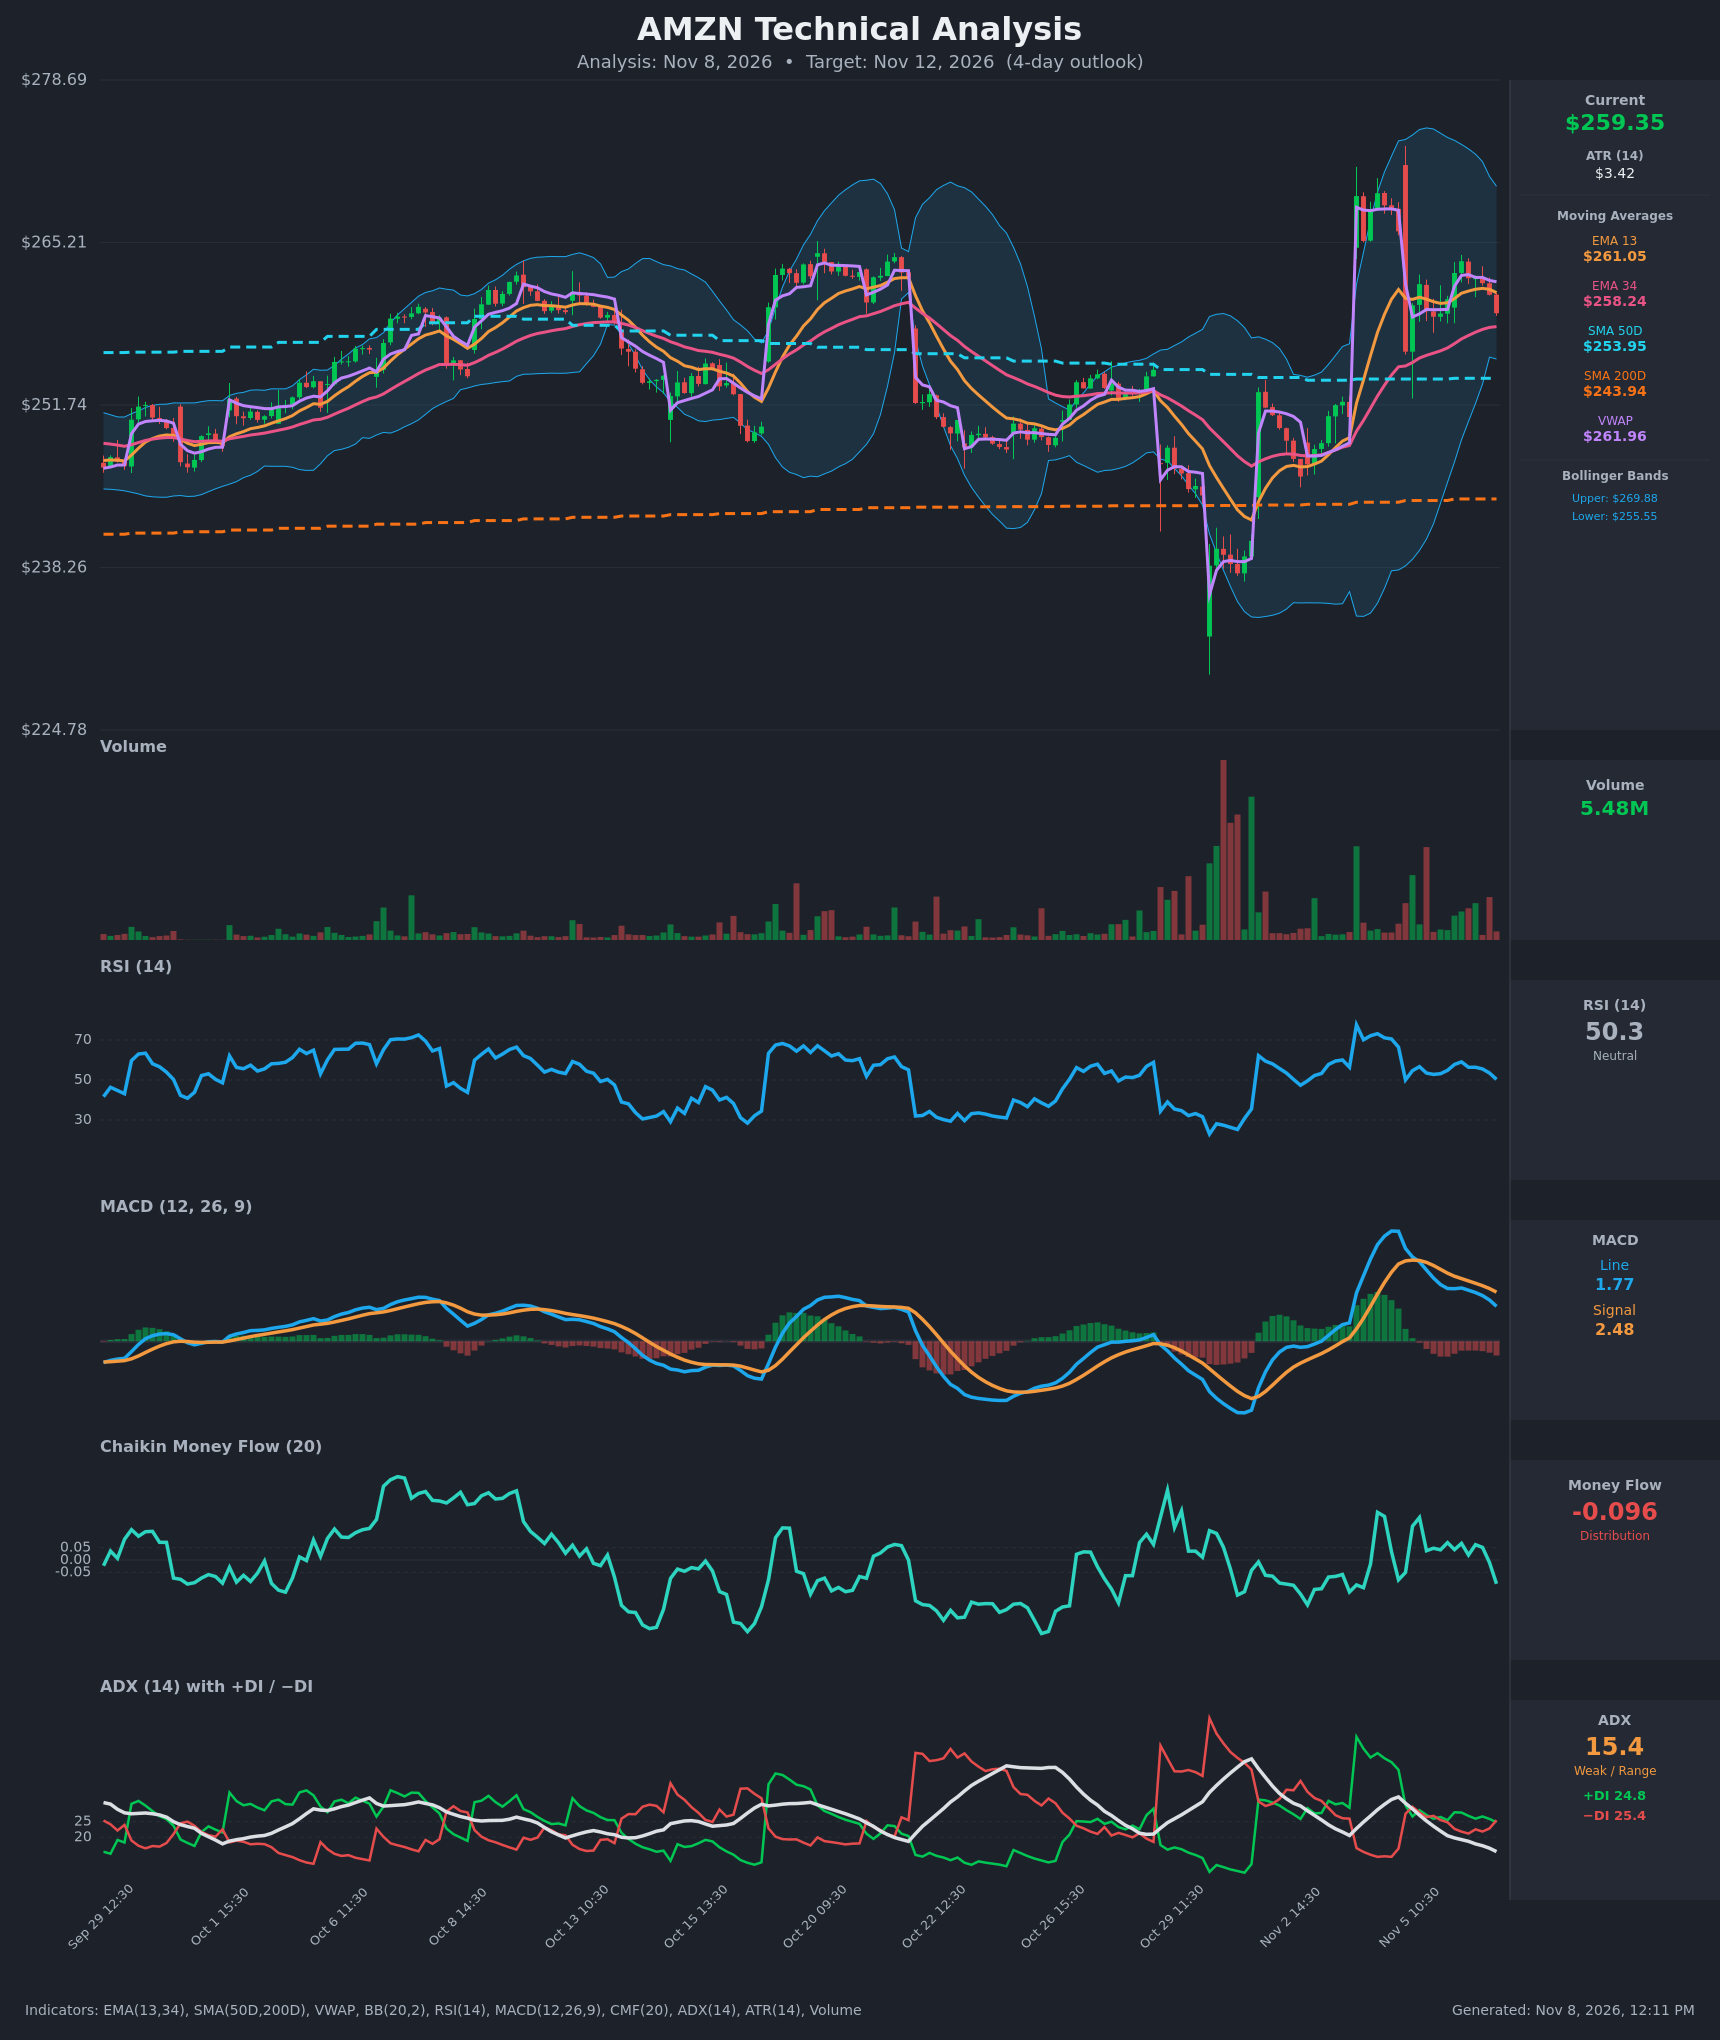
- RSI (14): 50.3, dead neutral and fading from 59 on Nov 6 morning. Momentum is rolling over from the recent bounce. [Neutral]
- 20 EMA: The chart uses EMA 13 ($261.05) and EMA 34 ($258.24). Price at $259.35 is below the EMA 13, which now acts as resistance, but above the EMA 34, which is nearby support. EMA 13 is still above EMA 34, so there is no bearish crossover, but the gap is narrowing. [Neutral]
- MACD: Line 1.77 is below signal 2.48, and the histogram is negative and widening. The line crossed below the signal on Nov 5 and has been falling since the Nov 3-4 spike. Momentum is clearly decelerating. [Bearish]
- Bollinger Bands (20): Upper $269.88, lower $255.55, so the bands are wide after the earnings gap. Price is in the lower half, below the midline of about $262.7, and is drifting toward the lower band, which sits only about $3.80 below. [Bearish]
- CMF (20): -0.096, below -0.05 and dropping sharply from slightly positive readings. This is distribution and selling pressure on the last bars. [Distribution]
- ADX (14): 15.4 and falling, so there is no meaningful trend. -DI (25.4) has just crossed above +DI (24.8), a marginal bearish tilt in a range-bound environment. [Weak Trend, slight bearish tilt]
- Volume: 5.48M, modest compared with the huge earnings-gap volume in late October and early November. Volume is declining, so there is no conviction behind the current move. Price is also below VWAP ($261.96), which shows sellers in control intraday. [Neutral to Bearish]
DIVERGENCES & TRENDS
- There is no clean divergence. MACD has been fading since the Nov 4 peak while price has held a $259–$264 range, which means momentum is bleeding without price breaking down yet.
- The MACD bearish crossover (Nov 5) is confirmed by a widening negative histogram.
- CMF dropped from about +0.07 to -0.096 over the last few bars, and the DI lines have just flipped to -DI on top. Both point to a fresh shift toward selling.
- Price lost the VWAP and the EMA 13 on the last two bars. It is still above the EMA 34 ($258.24), the SMA50 ($253.95) and the SMA200 ($243.94), so the larger structure remains bullish. SMA50 is above SMA200, so there is no death cross.
- Over the last several sessions, price has been consolidating after the gap-up and failed rally to $266–$270.
CHART PATTERNS
- Price is forming a loose sideways consolidation, a mild bearish flag/pennant-style digestion after the sharp gap-up, with lower highs (about $263.66 on Nov 6, below earlier highs) and support near $258–$259. This resembles a Bearish Pennant or a small Symmetrical Triangle, though neither is textbook.
- The earlier spike to about $270 and the failure back into the range look like a short-term blow-off, a mild double-top-like structure with resistance around $264–$266.
- Downside target if the $258 EMA 34 breaks: the $255.5 lower Bollinger Band, then the $253.95 SMA50, which was the gap base. Upside is capped near $262–$264.
POTENTIAL SCENARIOS
- Scenario 1: Bearish Drift to the Lower Band — The bearish MACD crossover, CMF distribution, -DI above +DI and the loss of VWAP and EMA 13 push price through the EMA 34 toward the lower Bollinger Band. Trigger: a close below $258.20 (EMA 34). Target: $255.50, with an extension to $254. Invalidation: a reclaim of $262 (VWAP and EMA 13). (50% probability)
- Scenario 2: Neutral Range Chop — ADX is weak at 15, so price oscillates between the EMA 34 support and EMA 13/VWAP resistance. Trigger: holds $257.5–$262. Target: $258–$261. Invalidation: a close outside $257 or $263. (28% probability)
- Scenario 3: Bullish Reclaim — Buyers defend the EMA 34 and push back above VWAP, squeezing toward the band midline. Trigger: a close above $262 on rising volume. Target: $264–$266. Invalidation: a drop below $257.5. (22% probability)
PRICE TARGETS
For a 4-day horizon, the range width guide is roughly 4–6% of price. The expected range is $253.30 to $263.30, a $10.00 width, which is about 3.9% of $259.35. That is slightly wider than the 2–3 day guide and appropriate for 4 days, with the ATR of $3.42 implying a typical 4-day move of about ±$6.8 (2 ATR).
- Target Price: $257.00 (4 days)
- Expected Range: $252.50 to $263.00 (about $10.50 width, roughly 4.0%)
- Key Levels: Support at $255.55 (lower Bollinger Band; the EMA 34 at $258.24 is the first minor support), Resistance at $262.00 (VWAP/EMA 13 area)
OVERALL BIAS
OVERALL BIAS: BEARISH - A bearish MACD crossover with a widening negative histogram, CMF in distribution, -DI crossing above +DI, and price below both VWAP and EMA 13 point to a drift toward the $255.5 lower band. The weak ADX and the long-term uptrend structure cap the conviction.
This is educational analysis and not financial advice.