AMZN 6-day bearish forecast — Nov 8, 2026
- Bias: Bearish
- Timeframe: 6 days (made Nov 8, 2026, target date Nov 13, 2026)
- Price at analysis: $259.35
- Price target: $256.50
- Expected range: $250.00 – $265.00
- Result: Incorrect (+2.8%) — closed at $266.66 on Nov 13, 2026; quality score 36/100
Get a free AI analysis of AMZN today
Analysis
TECHNICAL INDICATORS
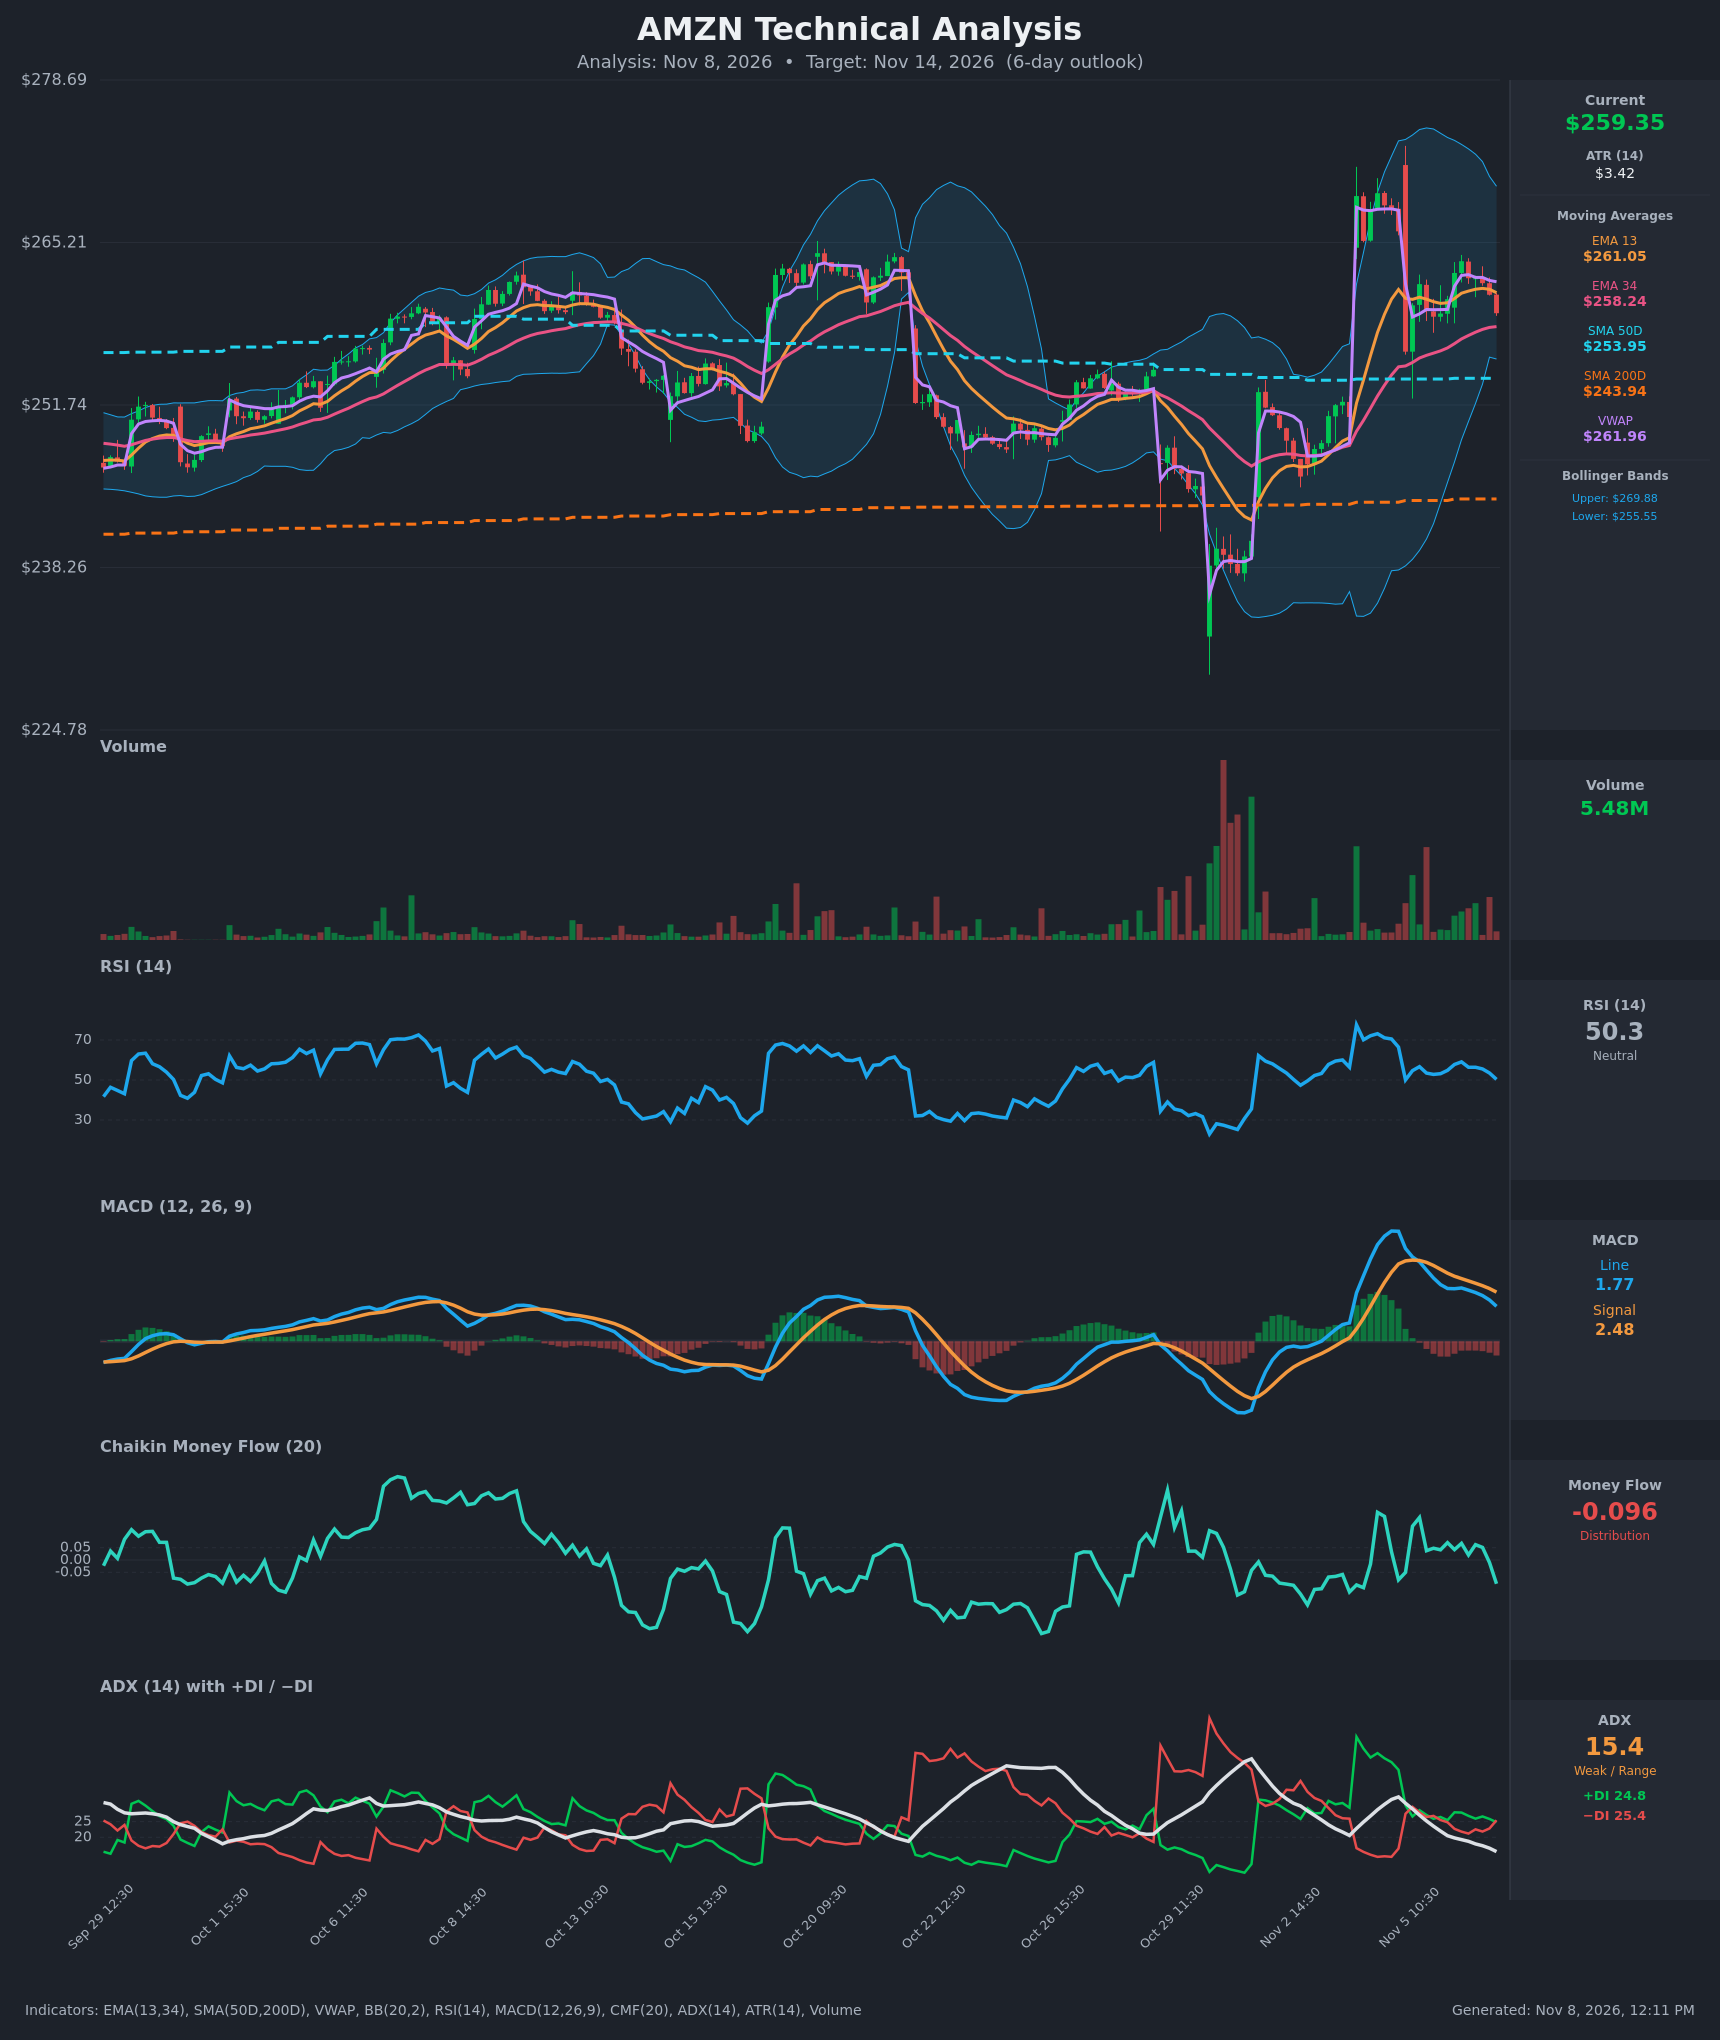
- RSI (14): 50.3, down from 59.1 on Nov 6 at 10:30 and now sitting on the midline. Momentum has faded from mildly positive to neutral with a downward slope. [Neutral]
- 20 EMA: The data gives EMA 13 at $261.05 and EMA 34 at $258.24. Price at $259.35 is below the EMA 13, which is now acting as resistance, but still above the EMA 34. The EMA 13/34 spread has narrowed from about $6.4 to $2.8 over the recent bars, so a bearish cross is possible if weakness continues. [Bearish]
- MACD: The line (1.77) is below the signal (2.48) and the histogram is negative at about -0.72. The line crossed under the signal on Nov 5 at 11:30 and has kept falling toward zero. [Bearish]
- Bollinger Bands (20): The bands run from $255.55 to $269.88, and price at $259.35 is in the lower half of the range, below the midline of about $262.7. The bands are wide after the Nov 4 gap-up spike and are starting to contract. The lower band at $255.55 is the first volatility support. [Neutral]
- CMF (20): -0.096 is below the -0.05 threshold. It fell from +0.06 to -0.096 in the last two bars, so selling pressure is rising. [Distribution]
- ADX (14): 15.4 and falling steadily from 32.9, so the trend is weak and range-bound. −DI (25.4) has just crossed above +DI (24.8), a marginal bearish tilt. [Weak Trend, slight bearish tilt]
- Volume: 5.48M, with no expansion on the recent dips or bounces and nothing like the Nov 4–5 spike volume. The post-gap move is consolidating on moderate participation, with no strong conviction either way. [Neutral / slight caution]
DIVERGENCES & TRENDS
- Price vs. long-term averages: Price is above the SMA50 ($253.95) and SMA200 ($243.94), and the SMA50 is well above the SMA200 (a golden cross is already in place). The long-term uptrend is intact.
- Short-term deterioration: Price has slipped below the VWAP ($261.96) and the EMA 13. Nov 6 closed at the day's low ($259.35) after a $263.66 high.
- Momentum: The MACD histogram is negative and the MACD line is rolling over. The RSI is also falling. Neither has produced a bullish divergence.
- Lower highs: Peaks have fallen from about $273 (Nov 4 spike) to about $264 (Nov 6).
- ADX: It has dropped from 33 to 15 as the post-gap trend exhausts itself. The −DI/+DI cross is fresh and marginal.
- CMF: It has turned from slightly positive to distribution.
CHART PATTERNS
- Consolidation after the gap-up: The pattern resembles a Bullish Pennant/Flag. Price spiked from about $245 to about $266–273 and is now drifting in a tightening range with lower highs. This is a continuation setup, but the supporting indicators (MACD, CMF, DI) don't confirm it. A bullish break needs a close above about $264–265, with a measured move toward $270+.
- Bearish alternative: The lower highs and loss of the VWAP and EMA 13 also resemble a Bearish Rising/Descending Triangle-type fade. A break below $255.5 would target the SMA50 at about $254 and the gap area near $250–252.
- Read: The pattern is not decisive. With the weaker momentum and money flow, the downside side has a modest edge over 6 days.
POTENTIAL SCENARIOS
- Scenario 1: Bearish Fade Toward Lower Band/SMA50 — Distribution, a negative MACD and the −DI cross pull price down to test the lower Bollinger Band and the SMA50 zone. Trigger: a failure to reclaim the $261–262 VWAP/EMA 13 area and a break below the EMA 34 at $258.24. Target: $255.50, then $253.95. Invalidation: a daily close above $262.5. (50% probability)
- Scenario 2: Neutral Range Chop — Weak ADX keeps price between the EMA 34 and VWAP. Trigger: low-volume, indecisive trading around the $258–262 band. Target: $257–261. Invalidation: a close below $255.5 or above $264. (28% probability)
- Scenario 3: Bullish Pennant Breakout — Buyers defend the EMA 34/$258 area, the MACD flattens, and price breaks out of the consolidation. Trigger: a close above $264 on rising volume. Target: $268–270 (upper Bollinger Band). Invalidation: a close below $257. (22% probability)
PRICE TARGETS
- Target Price: $256.50 (6-day)
- Expected Range: $250.00 to $265.00 (width $15.00, about 5.8% of the current price, within the 4–8% guidance for a 6-day horizon)
- Key Levels: Support at $255.50 (lower Bollinger Band, with the SMA50 near $253.95 below it), Resistance at $262.00 (VWAP/EMA 13 area)
OVERALL BIAS
OVERALL BIAS: BEARISH - The MACD is below its signal with a negative histogram, CMF shows distribution, −DI has crossed above +DI, and price has lost the VWAP and EMA 13. Conviction is modest because the ADX is weak and the long-term trend (price above the SMA50 and SMA200) is still intact, so the expected move is a pullback toward $255–256 rather than a breakdown.
This is educational analysis and not financial advice.