CRWV 4-day bullish forecast — Nov 8, 2026
- Bias: Bullish
- Timeframe: 4 days (made Nov 8, 2026, target date Nov 11, 2026)
- Price at analysis: $46.37
- Price target: $47.40
- Expected range: $45.00 – $48.00
- Result: Correct (+31.1%) — closed at $60.77 on Nov 11, 2026; quality score 50/100
Get a free AI analysis of CRWV today
Analysis
TECHNICAL INDICATORS
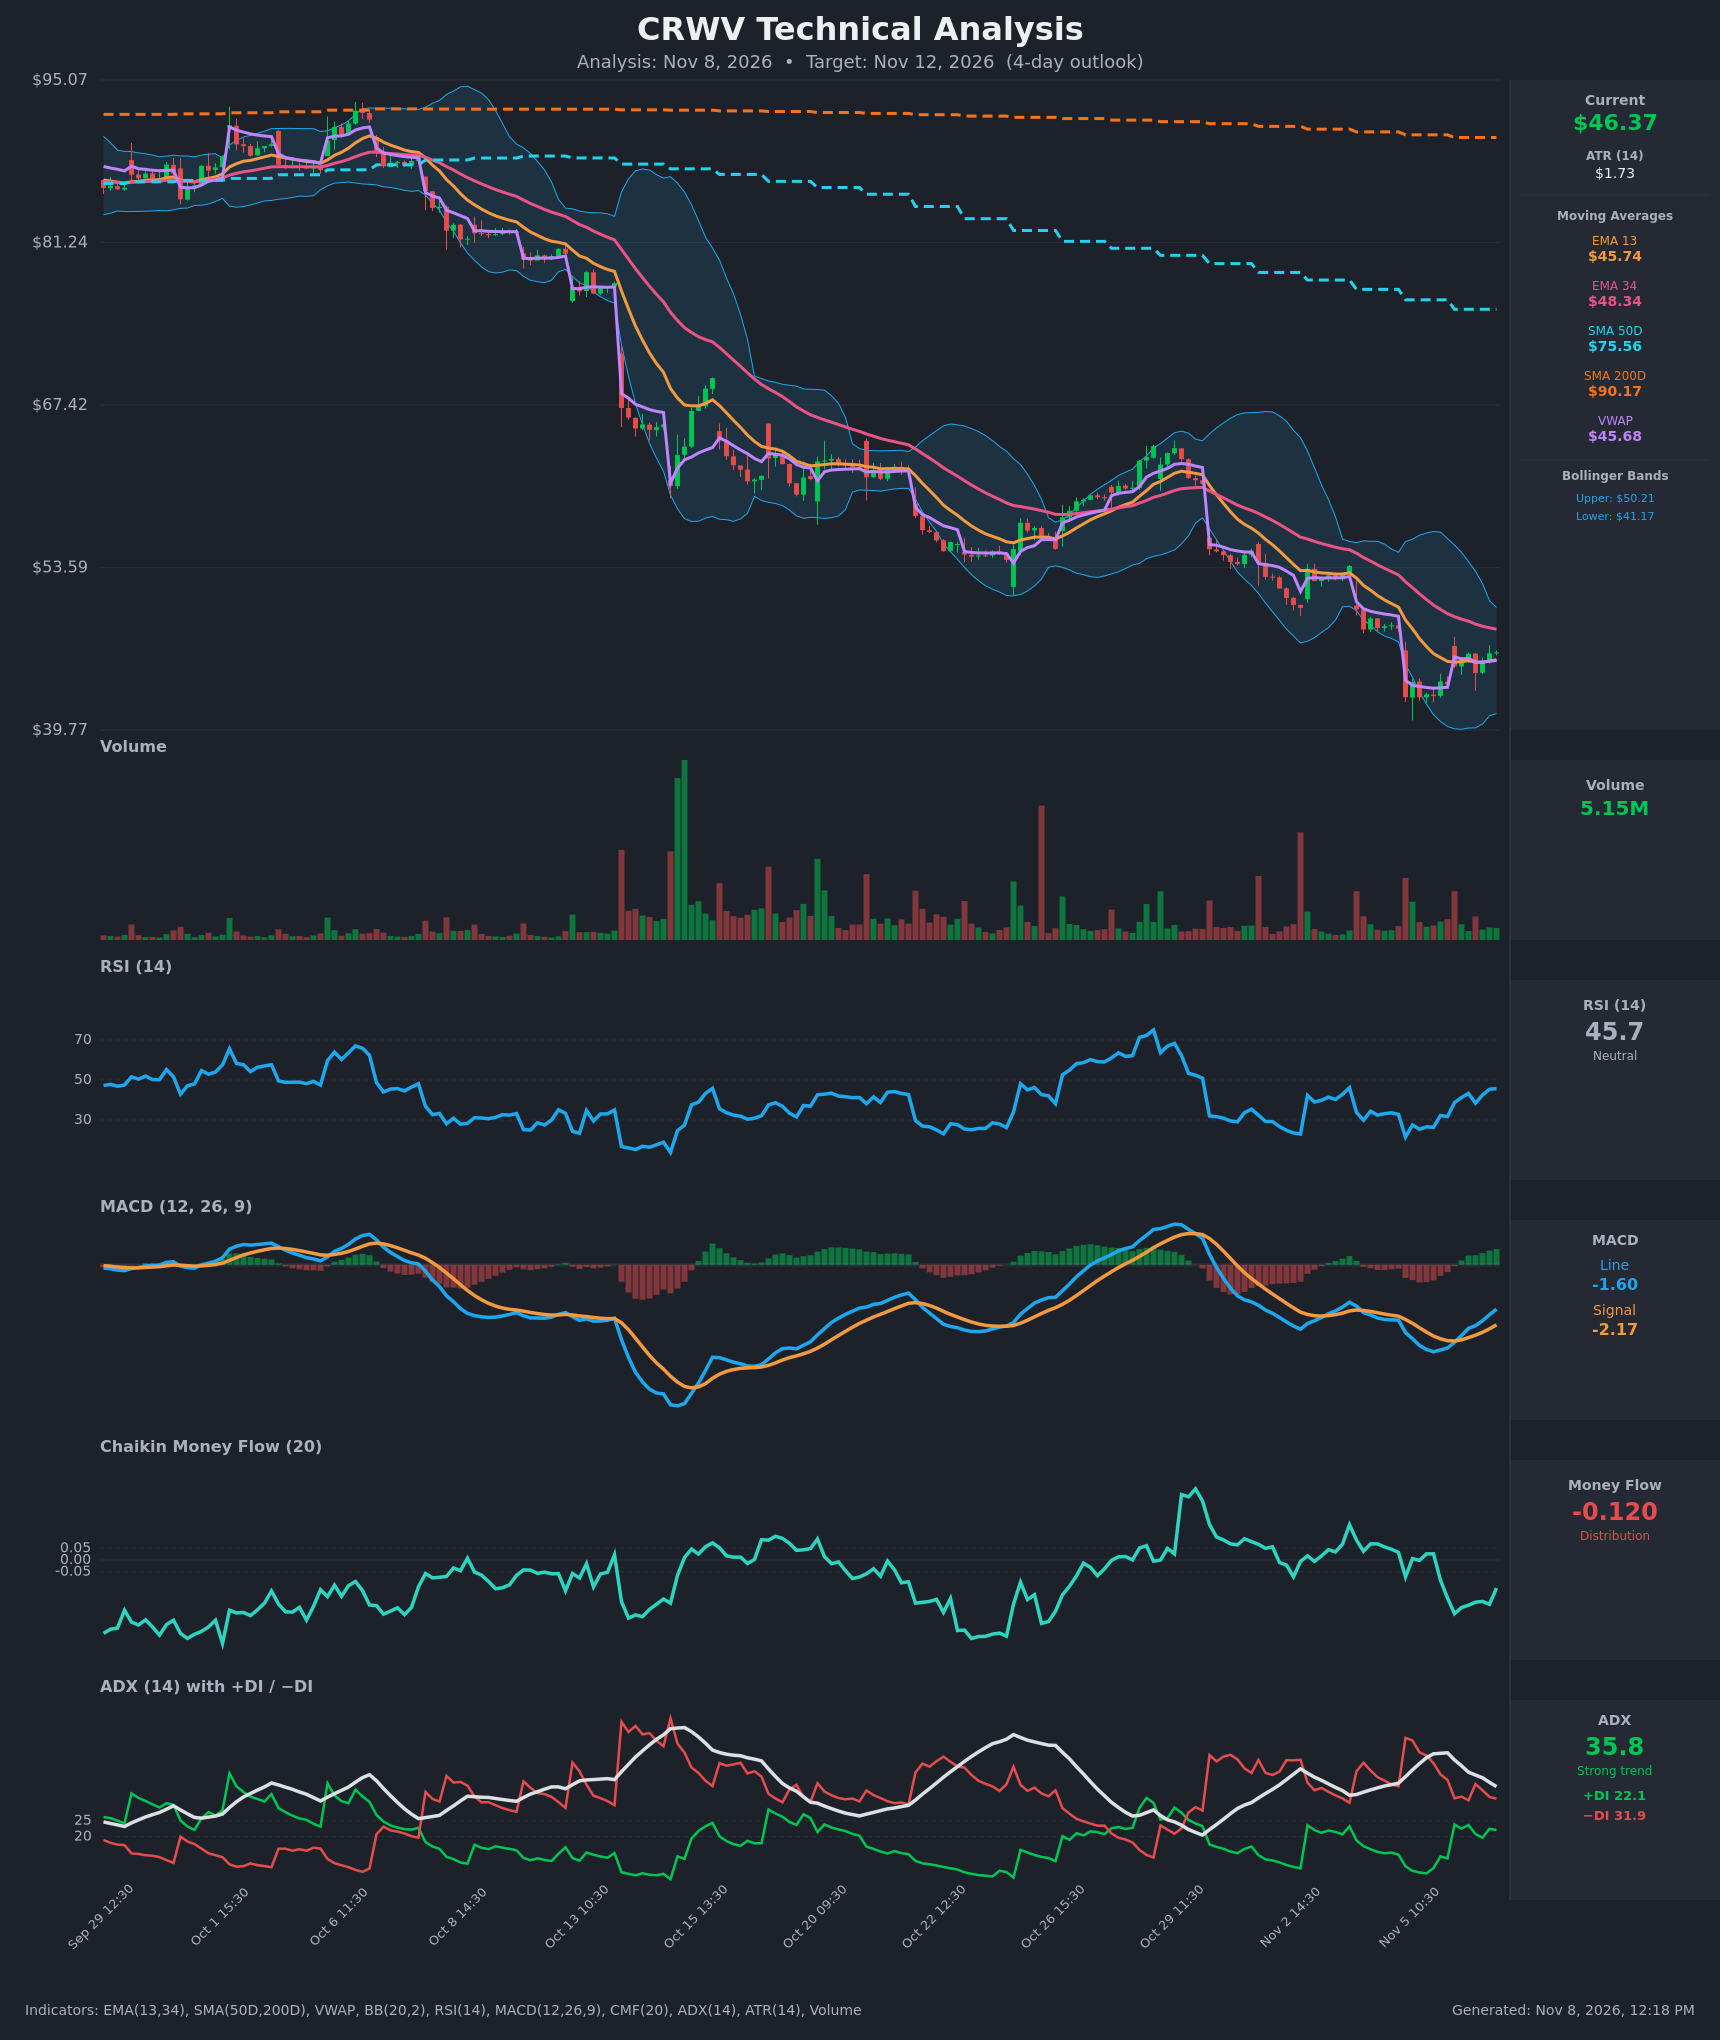
- RSI (14): 45.70, up from a deeply oversold 21.4 on Nov 5. It is rising steadily and has moved back to the neutral midline. It is not yet above 50, so the recovery is not confirmed. [Bullish]
- 20 EMA: The chart shows EMA 13 at $45.74 and EMA 34 at $48.34. Price ($46.37) is above the EMA 13, which is now short-term support. It is still below the EMA 34, which is falling and acts as overhead resistance. EMA 13 is well below EMA 34, so the bearish alignment is intact. [Neutral]
- MACD: Line -1.60 versus signal -2.17, with the histogram still negative but shrinking. The line has risen for 7 straight bars and is closing on the signal, so a bullish crossover is likely within 2-3 bars. Both lines remain below zero, so this is a relief rally inside a downtrend. [Bullish]
- Bollinger Bands (20): Upper $50.21, lower $41.17, midline about $45.69. Price has climbed off the lower band and is sitting just above the midline. The bands are narrowing after the washout. The upper band is a plausible ceiling near $50, but the EMA 34 comes first. [Neutral]
- CMF (20): -0.120, below the -0.05 threshold, so there is distribution. It has improved from -0.229 on Nov 6 but is still negative, so buyers are not convincingly behind the bounce. [Distribution]
- ADX (14): 35.8, a strong trend, but falling from 46.4, so the downtrend is losing momentum. -DI (31.9) is still above +DI (22.1), though the gap has narrowed from about 40 points to about 10. Bears still control the trend, with waning force. [Strong Trend – Bearish, weakening]
- Volume: 5.15M, small compared with the capitulation bars on the way down. The bounce is on light volume, which is not a strong confirmation of buying. Price is above VWAP ($45.68), a modest intraday positive. [Neutral / Slightly Bullish]
DIVERGENCES & TRENDS
- Momentum recovery: Price made a low near $40-42 on Nov 5. RSI went from 21 to 46 and MACD has turned up sharply. Short-term momentum has clearly shifted from oversold to recovering.
- Higher lows: Hourly closes ran $42.55 → $43.90 → $44.62 → $46.37, a short-term uptrend off the bottom.
- Long-term trend: Price is far below the SMA 50D ($75.56) and SMA 200D ($90.17). A death cross is already in place, since the SMA 50D sits well below the SMA 200D. EMA 13 is below EMA 34 with no crossover yet.
- MACD: A bullish crossover is approaching (gap 0.57 and closing roughly 0.15-0.2 per bar). It has not happened yet.
- ADX/DI: -DI remains above +DI with no bullish DI crossover, but the gap is shrinking.
- CMF: It remains negative, so money flow lags the price bounce. This is a mild caution that the rally may be a counter-trend bounce.
CHART PATTERNS
- Macro structure: A clear sequence of lower highs and lower lows since early October, with a large breakdown from about $75 to $55 and then to $40. This resembles a bearish continuation structure (a descending channel with Bearish Flag/Descending Triangle character).
- Short-term: The past three days show a base around $42-46 after capitulation, which fits a tentative bounce (similar in spirit to the Bullish Falling Wedge or a small double bottom near $42.5). It is unconfirmed until price clears the EMA 34 at about $48.3.
- Targets: A bounce to the EMA 34 at $48.3 is about +4%. A clean break would open the upper Bollinger Band at about $50.2. A failure at $48 and a drop below $44.6 would retest the $41-42 lows.
POTENTIAL SCENARIOS
- Scenario 1: Bullish Relief Bounce to EMA 34 — MACD crosses up through its signal line and RSI pushes above 50, drawing price toward the falling EMA 34. Trigger: hold above $45.70 (EMA 13/VWAP) and a hourly close above $47.00. Target: $47.50-$48.30. Invalidation: close below $44.60. (55% probability)
- Scenario 2: Bearish Rejection and Trend Resumption — The bounce stalls under the EMA 34 on light volume with CMF still negative, and sellers (−DI dominance) push price back down. Trigger: rejection at $47.50-$48.30 and a break below $45.70. Target: $43.50-$44.50, then a retest of $41-42. Invalidation: sustained close above $48.50. (35% probability)
- Scenario 3: Neutral Chop — Price oscillates around $45.7-$47.0 as the MACD crossover plays out without follow-through. Trigger: low-volume drift. Target: $45.50-$47.00. Invalidation: a break outside $44.60-$48.30. (10% probability)
PRICE TARGETS
- Target Price: $47.40 (4-day horizon; ATR $1.73 implies about ±$3.5 over 4 days, and the target sits just below the EMA 34 resistance)
- Expected Range: $45.00 to $48.00 (width $3.00 = about 6.5% of current price, appropriate for a 4-day horizon)
- Key Levels: Support at $45.68 (VWAP/EMA 13; a break exposes $44.60), Resistance at $48.34 (EMA 34)
OVERALL BIAS
OVERALL BIAS: BULLISH - A short-term relief bounce is more likely over 4 days. RSI has recovered from oversold, MACD is about to cross up, price is above the EMA 13 and VWAP, and ADX is fading. The bias is modest because CMF shows distribution, -DI still leads, and the EMA 34 ($48.34) and the long-term SMAs overhead cap the upside.
This is educational analysis and not financial advice.