CRWV 6-day bearish forecast — Nov 8, 2026
- Bias: Bearish
- Timeframe: 6 days (made Nov 8, 2026, target date Nov 13, 2026)
- Price at analysis: $46.37
- Price target: $44.80
- Expected range: $43.20 – $46.90
- Result: Incorrect (+14.6%) — closed at $53.13 on Nov 13, 2026; quality score 0/100
Get a free AI analysis of CRWV today
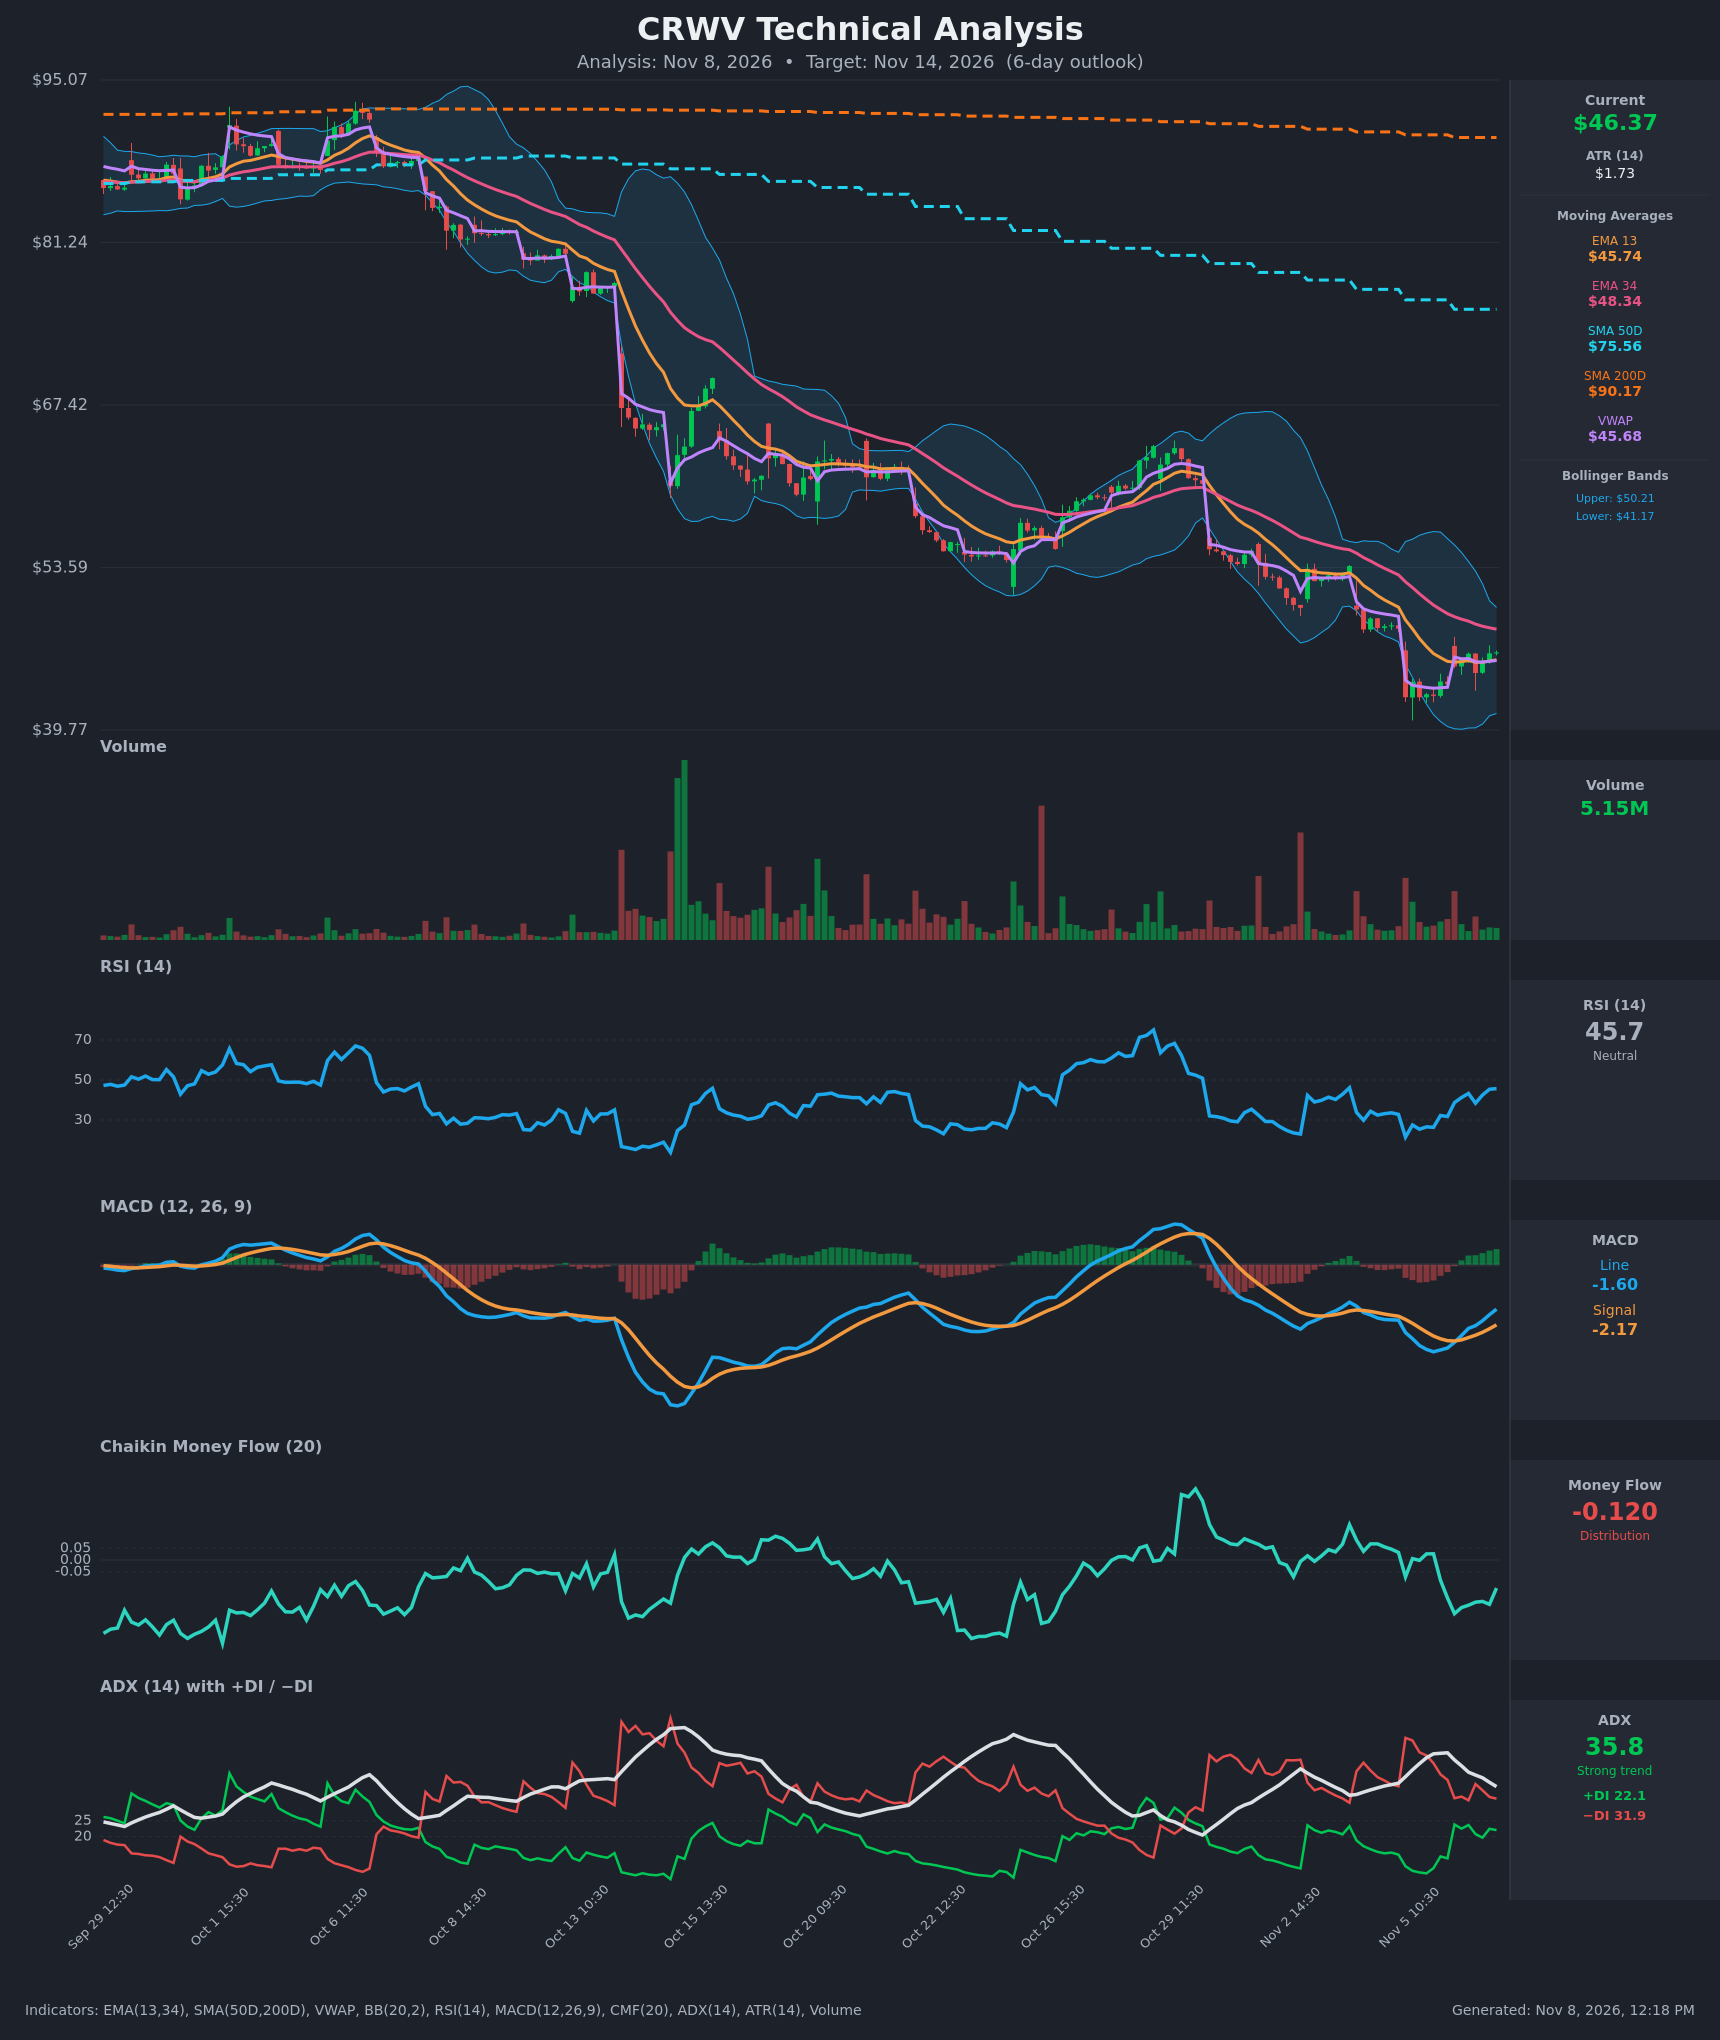
Analysis
TECHNICAL INDICATORS
- RSI (14): 45.70, rising from 21.4 on Nov 5 and now near the midline. Oversold has been fully unwound, but 45.7 is still below 50 and below the prior relief-rally highs. Momentum is improving but not yet bullish. [Neutral]
- 20 EMA: The chart shows EMA 13 at $45.74 and EMA 34 at $48.34. Price ($46.37) is above the EMA 13, which is acting as minor support. It is below the EMA 34, which is falling and acts as resistance about 4.3% overhead. EMA 13 is well under EMA 34, so the bearish alignment is intact. [Bearish]
- MACD: Line -1.605 vs signal -2.171, histogram about +0.57. The line crossed above the signal around Nov 6 10:30. Both remain well below zero, so this is a counter-trend relief crossover, not a trend change. [Bullish]
- Bollinger Bands (20): Upper $50.21, lower $41.17, middle about $45.69. Price sits just above the midline after bouncing off the lower band (~$40 low). The bands are contracting after the sharp selloff, which suggests volatility compression. The $50.21 upper band is the ceiling for a bounce. [Neutral]
- CMF (20): -0.120, below the -0.05 threshold. It has been negative for the whole bounce, so selling pressure continues despite the price recovery. [Distribution]
- ADX (14): 35.8, still a strong trend but falling from 46.4. −DI (31.9) is above +DI (22.1), so bears are still in control. The gap is narrowing, which points to a fading downtrend or a pause. [Strong Trend – Bearish, weakening]
- Volume: 5.15M, light compared with the capitulation spikes earlier in the decline. The bounce is happening on low volume, so buyers lack conviction. Price is above VWAP ($45.68), a small intraday positive. [Weak bounce / lack of conviction]
DIVERGENCES & TRENDS
- Price vs RSI/MACD: Price made a new low around $40 while RSI and MACD momentum were recovering from extreme readings. This shows selling exhaustion, but it is not a confirmed bullish divergence.
- CMF vs price: Price rebounded from about $42.5 to $46.4, but CMF stayed negative (-0.12). This is a bearish divergence, and it suggests the rally is not backed by accumulation.
- ADX/DI: ADX is falling from 46 while −DI stays above +DI. The sell-off is losing intensity, but there is no bullish DI crossover yet.
- Crossovers:
- The MACD bullish crossover below zero is a relief signal only.
- EMA 13 remains below EMA 34.
- SMA 50D ($75.56) is far below SMA 200D ($90.17), a long-standing death cross.
- Price is about 38% below the SMA 50D and about 49% below the SMA 200D, so the long-term trend is firmly down.
- Trend: The series of lower highs and lower lows since early October is intact. The recent bounce has not broken the descending EMA 34 or retaken the $48-50 area.
CHART PATTERNS
- Bearish Flag / Pennant (continuation): After the steep Nov 4-5 drop, price has formed a small, low-volume, upward-drifting consolidation between $42.5 and $46.4. This resembles a bearish flag or pennant. A breakdown below about $43 would project roughly the flag-pole length, targeting the $40 low and then lower.
- Possible small double bottom (~$40-42.5): This is a tentative bullish reversal candidate. It needs a break above the EMA 34 / $48.3 and the BB upper band near $50 to confirm, and volume does not support it yet.
- Larger structure: A persistent descending channel of lower highs since October, with price below all long-term moving averages. This is a continuation structure favoring the downside.
POTENTIAL SCENARIOS
- Scenario 1: Bearish Relief-Rally Failure — The bounce stalls below the falling EMA 34 and the low-volume flag rolls over, with CMF distribution and −DI dominance persisting. Trigger: rejection at $47-48.3, then a break below the EMA 13/VWAP (~$45.7) and the $43 flag support. Target: $43.50-44.80, with an extension toward $41-42. Invalidation: a daily close above $48.40 with rising volume. (45% probability)
- Scenario 2: Bullish Relief Extension — The MACD crossover and rising RSI carry price through the EMA 34 toward the upper Bollinger Band. Trigger: a push above $48.34 on increased volume and CMF turning positive. Target: $49.50-50.20. Invalidation: a drop back below $45.70 (EMA 13/VWAP). (35% probability)
- Scenario 3: Neutral Choppy Consolidation — Price oscillates around the middle band between $43.5 and $48 as ADX fades. Trigger: no break of either $43 or $48.3. Target: $45-47. Invalidation: a close outside the $43-48.3 range. (20% probability)
PRICE TARGETS
- Target Price: $44.80 (6-day horizon, about 3.4% below current)
- Expected Range: $43.20 to $46.90 (width $3.70, about 8.0% of current price, consistent with a short 6-day timeframe and ATR of $1.73)
- Key Levels: Support at $42.50, Resistance at $48.34
OVERALL BIAS
OVERALL BIAS: BEARISH - The bounce is a relief rally within a strong long-term downtrend. Price sits below the EMA 34 and the SMA 50/200, with CMF in distribution, −DI above +DI, and volume fading on the rebound. The positive MACD crossover and rising RSI limit the downside, so conviction is modest, with a likely rejection near $47-48.
This is educational analysis and not financial advice.