F 4-day bearish forecast — Nov 8, 2026
- Bias: Bearish
- Timeframe: 4 days (made Nov 8, 2026, target date Nov 11, 2026)
- Price at analysis: $12.45
- Price target: $12.36
- Expected range: $12.10 – $12.65
- Result: Correct (-1.6%) — closed at $12.25 on Nov 11, 2026; quality score 100/100
Get a free AI analysis of F today
Analysis
TECHNICAL INDICATORS
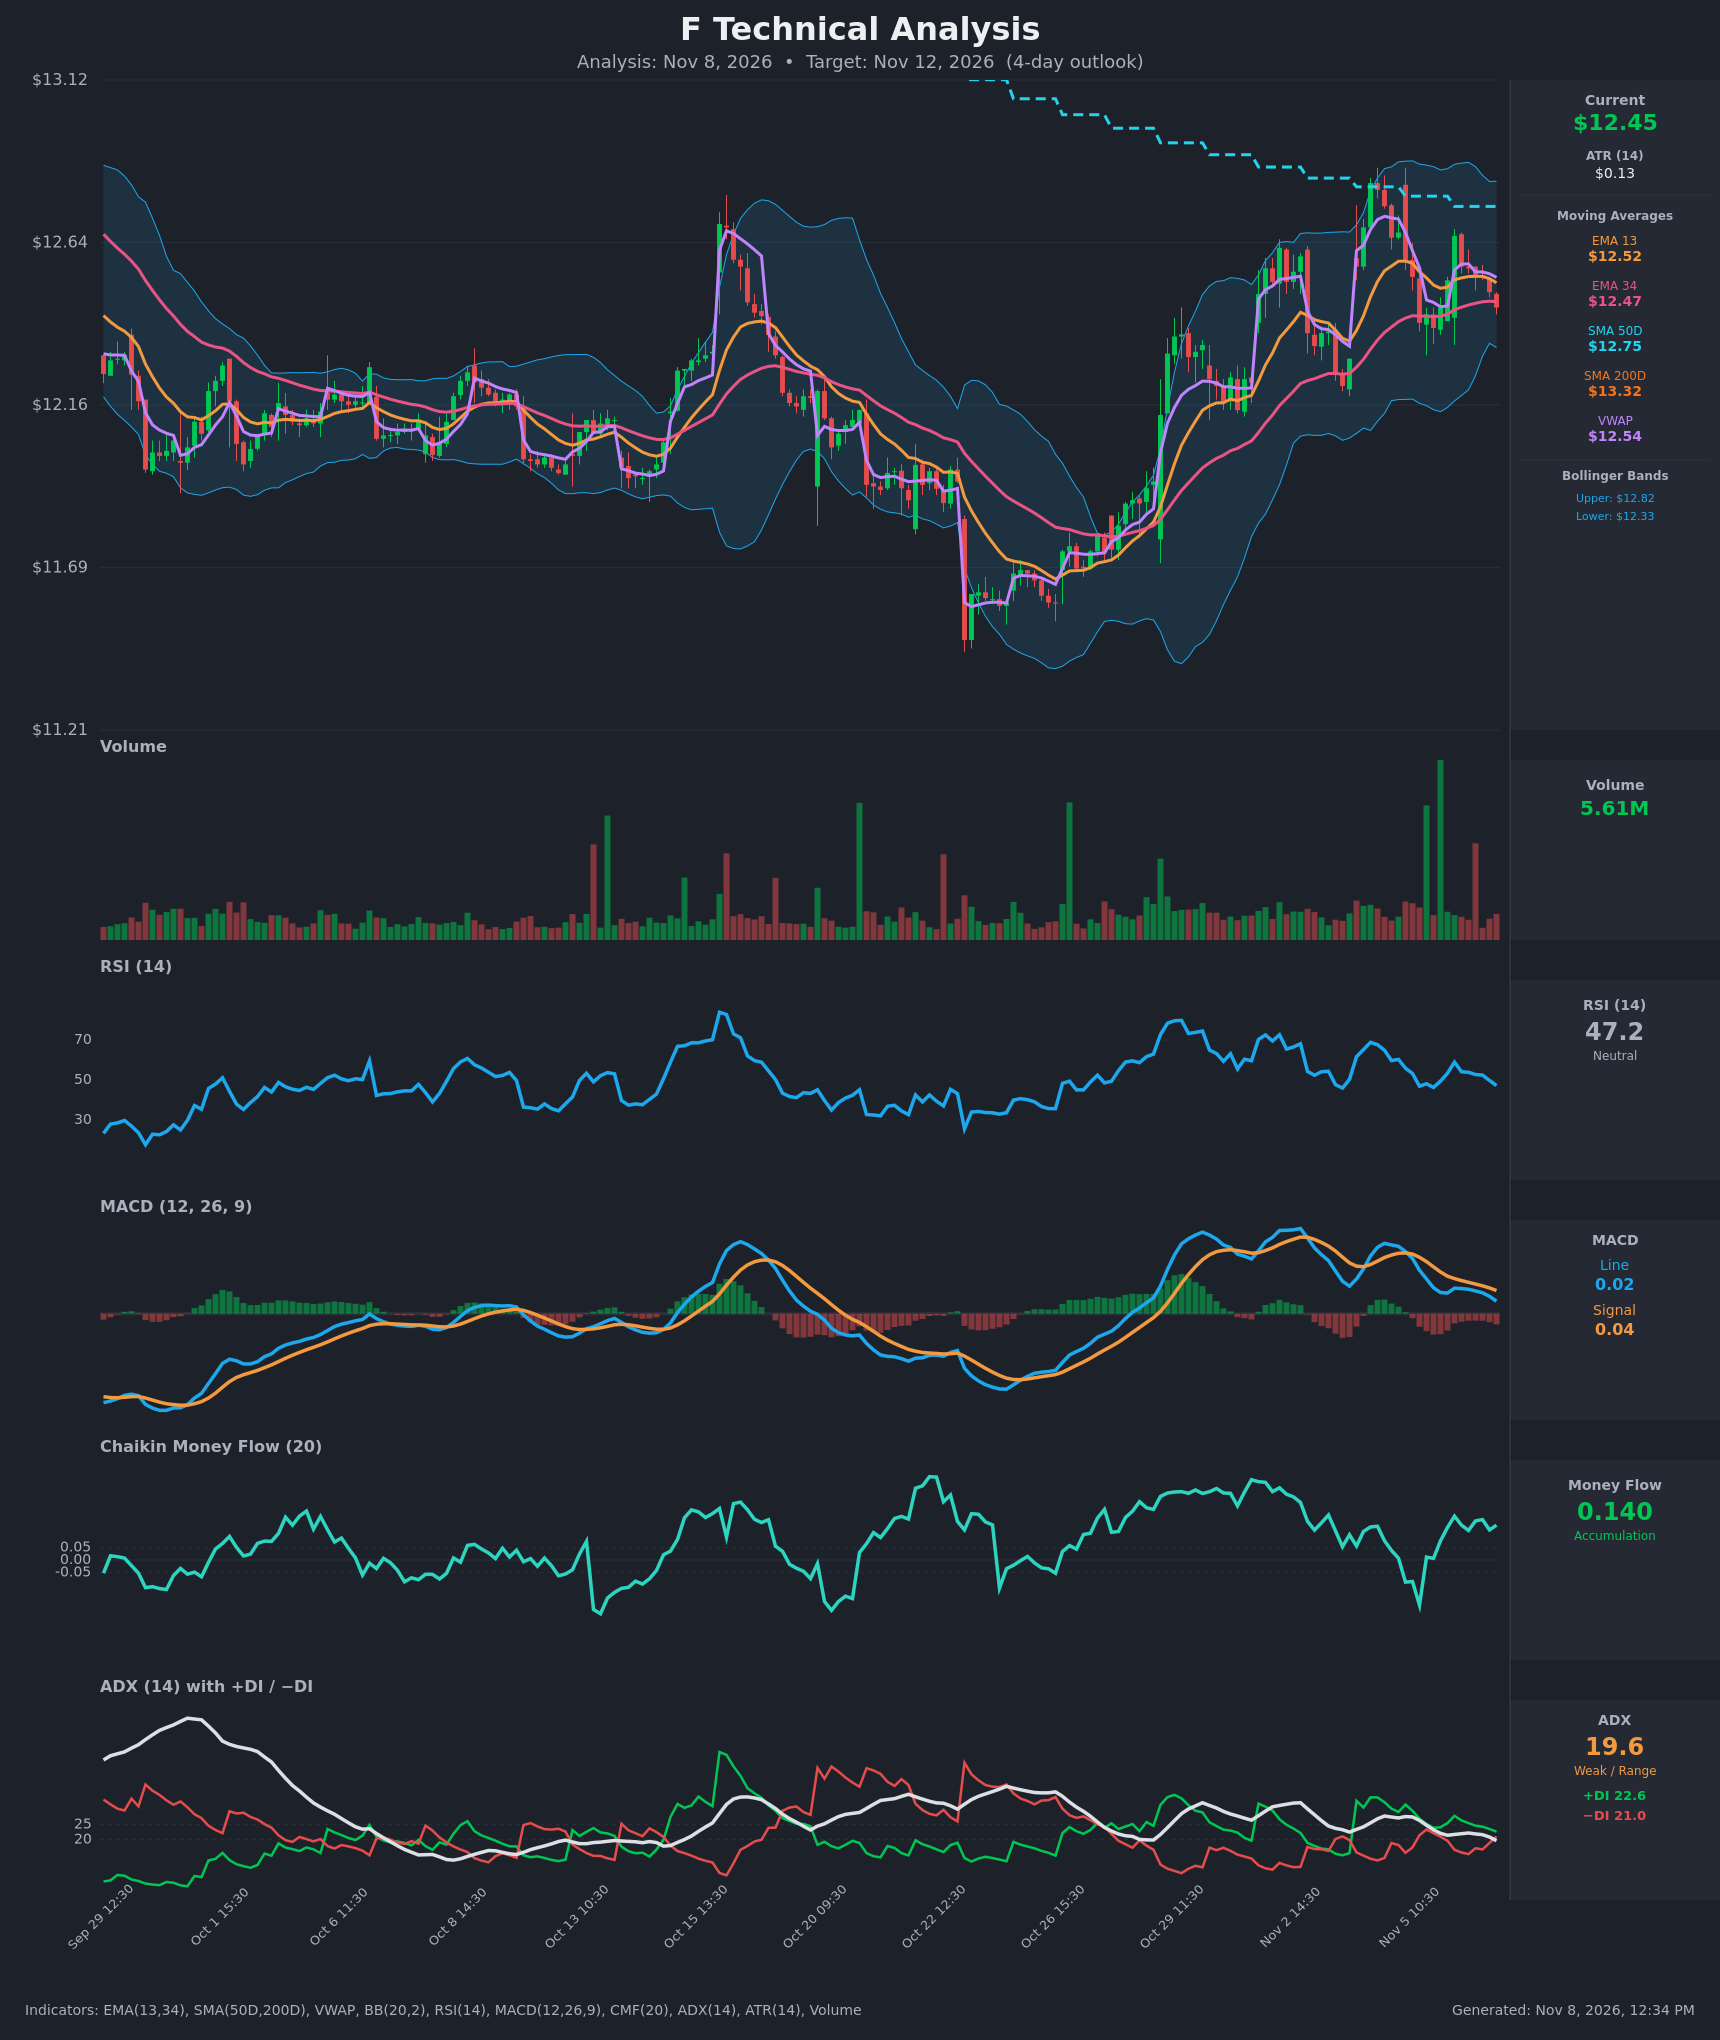
- RSI (14): 47.21, slipping from the 59 reading on Nov 6 open and below the 50 midline. Momentum is fading but not oversold. [Bearish]
- 20 EMA: The data gives EMA 13 at $12.5226 and EMA 34 at $12.4675. Price ($12.45) is below the EMA 13, which is now resistance, and just below the EMA 34. The EMA 13 is still above the EMA 34, but the gap is narrowing (0.05). A bearish cross is possible within days. [Bearish]
- MACD: Line 0.0235 is below Signal 0.0436, a bearish crossover that happened around Nov 5. The histogram is negative (about -0.02) and the line has fallen steadily from 0.127. Momentum is clearly decelerating. [Bearish]
- Bollinger Bands (20): Upper $12.8204, lower $12.3323, midline about $12.58. Price sits in the lower half, below the mid-band, with about $0.12 of room to the lower band. The bands are moderately wide after the late-October rally. [Bearish]
- CMF (20): 0.140, above +0.05 and positive for most of the recent bars, though it was negative on Nov 5 morning. Buying pressure under the surface is the main counterpoint to the weak momentum. [Accumulation]
- ADX (14): 19.6 and falling from 27, so the trend is weak and range-bound. +DI 22.6 is only marginally above −DI 21.0, and the gap has collapsed from 29/18. The directional edge is now nearly nil, with a slight tilt toward bears as the DIs converge. [Weak Trend, Neutral/Slightly Bearish]
- Volume: 5.61M, light relative to the spikes of recent weeks. Recent down bars show no heavy distribution, but there is no strong buying conviction on bounces either. [Neutral]
Other trend context:
- Price is below VWAP ($12.5385), which is a mild bearish reading.
- Price is below the SMA 50D ($12.7464) and SMA 200D ($13.3150). The SMA 50D is under the SMA 200D, so the long-term trend is bearish with no golden cross.
DIVERGENCES & TRENDS
- There is a mild divergence between CMF (positive, 0.14) and price/MACD (falling). Money flow is better than price action, which limits downside conviction.
- RSI has made lower highs (about 70 → 59 → 53) while price has stalled below the Nov 3-4 high near $12.80. That is a sign of waning upside momentum.
- MACD crossed bearishly and the histogram is expanding negative. The DI spread has narrowed from +14 to +1.6, and ADX has dropped below 20, so the late-October rally has lost its trend strength.
- Price is hugging the EMA 34 ($12.4675), the last short-term support. A close below it would give a bearish EMA 13/34 cross setup.
- Price is trapped under both the SMA 50D and SMA 200D, which cap rallies.
CHART PATTERNS
- Loose Bearish Double Top / lower-high structure: Peaks near $12.78-$12.80 (Nov 3-4) and the lower rebound high near $12.66 (Nov 6). The neckline sits around $12.33-$12.40. A break would project toward about $12.0, but that is beyond a 4-day horizon, so the pattern is only a partial influence.
- Range / Symmetrical Triangle-like consolidation: Price is compressing between the rising lows of the rally and the lower highs of Nov 4-6. ADX below 20 supports a range, with the resolution direction undecided.
- The broader structure since late September is a wide $11.6-$12.8 range, with price now in its upper half but under the long-term SMAs.
POTENTIAL SCENARIOS
- Scenario 1: Bearish Fade Toward Lower Band — Price stays under the EMA 13 and VWAP, MACD histogram keeps deepening, and price tests the lower Bollinger Band and EMA 34 breakdown. Trigger: close below $12.40 / EMA 34 ($12.47 area). Target: $12.30-$12.36, with an extension to $12.15. Invalidation: close above $12.57 (VWAP/BB midline). (45% probability)
- Scenario 2: Bullish Bounce on Accumulation — Positive CMF and a defended EMA 34/lower band spark a rebound. Trigger: reclaim of $12.54 (VWAP, EMA 13) on rising volume. Target: $12.65-$12.75. Invalidation: close below $12.33. (30% probability)
- Scenario 3: Neutral Range Chop — Weak ADX keeps price oscillating around $12.35-$12.55 through the window. Trigger: no break of either $12.33 or $12.57. Target: $12.40-$12.50. Invalidation: decisive close outside the $12.30-$12.60 band. (25% probability)
PRICE TARGETS
Self-check: range $12.10 to $12.65 = $0.55 width = 4.4% of $12.45. This fits between the 2-3 day (2-4%) and 7-10 day (4-8%) guidance for a 4-day horizon, and is consistent with an ATR of $0.127.
- Target Price: $12.36 (4-day)
- Expected Range: $12.10 to $12.65
- Key Levels: Support at $12.33, Resistance at $12.54
OVERALL BIAS
OVERALL BIAS: BEARISH - Price is below the EMA 13, VWAP, and both long-term SMAs, with a bearish MACD cross, falling RSI, and fading ADX/DI spread. Positive CMF tempers the conviction, so the expected drift is modest, toward the lower Bollinger Band near $12.33.
This is educational analysis and not financial advice.