F 6-day bearish forecast — Nov 8, 2026
- Bias: Bearish
- Timeframe: 6 days (made Nov 8, 2026, target date Nov 13, 2026)
- Price at analysis: $12.45
- Price target: $12.36
- Expected range: $12.00 – $12.75
- Result: Correct (-4.4%) — closed at $11.90 on Nov 13, 2026; quality score 86/100
Get a free AI analysis of F today
Analysis
TECHNICAL INDICATORS
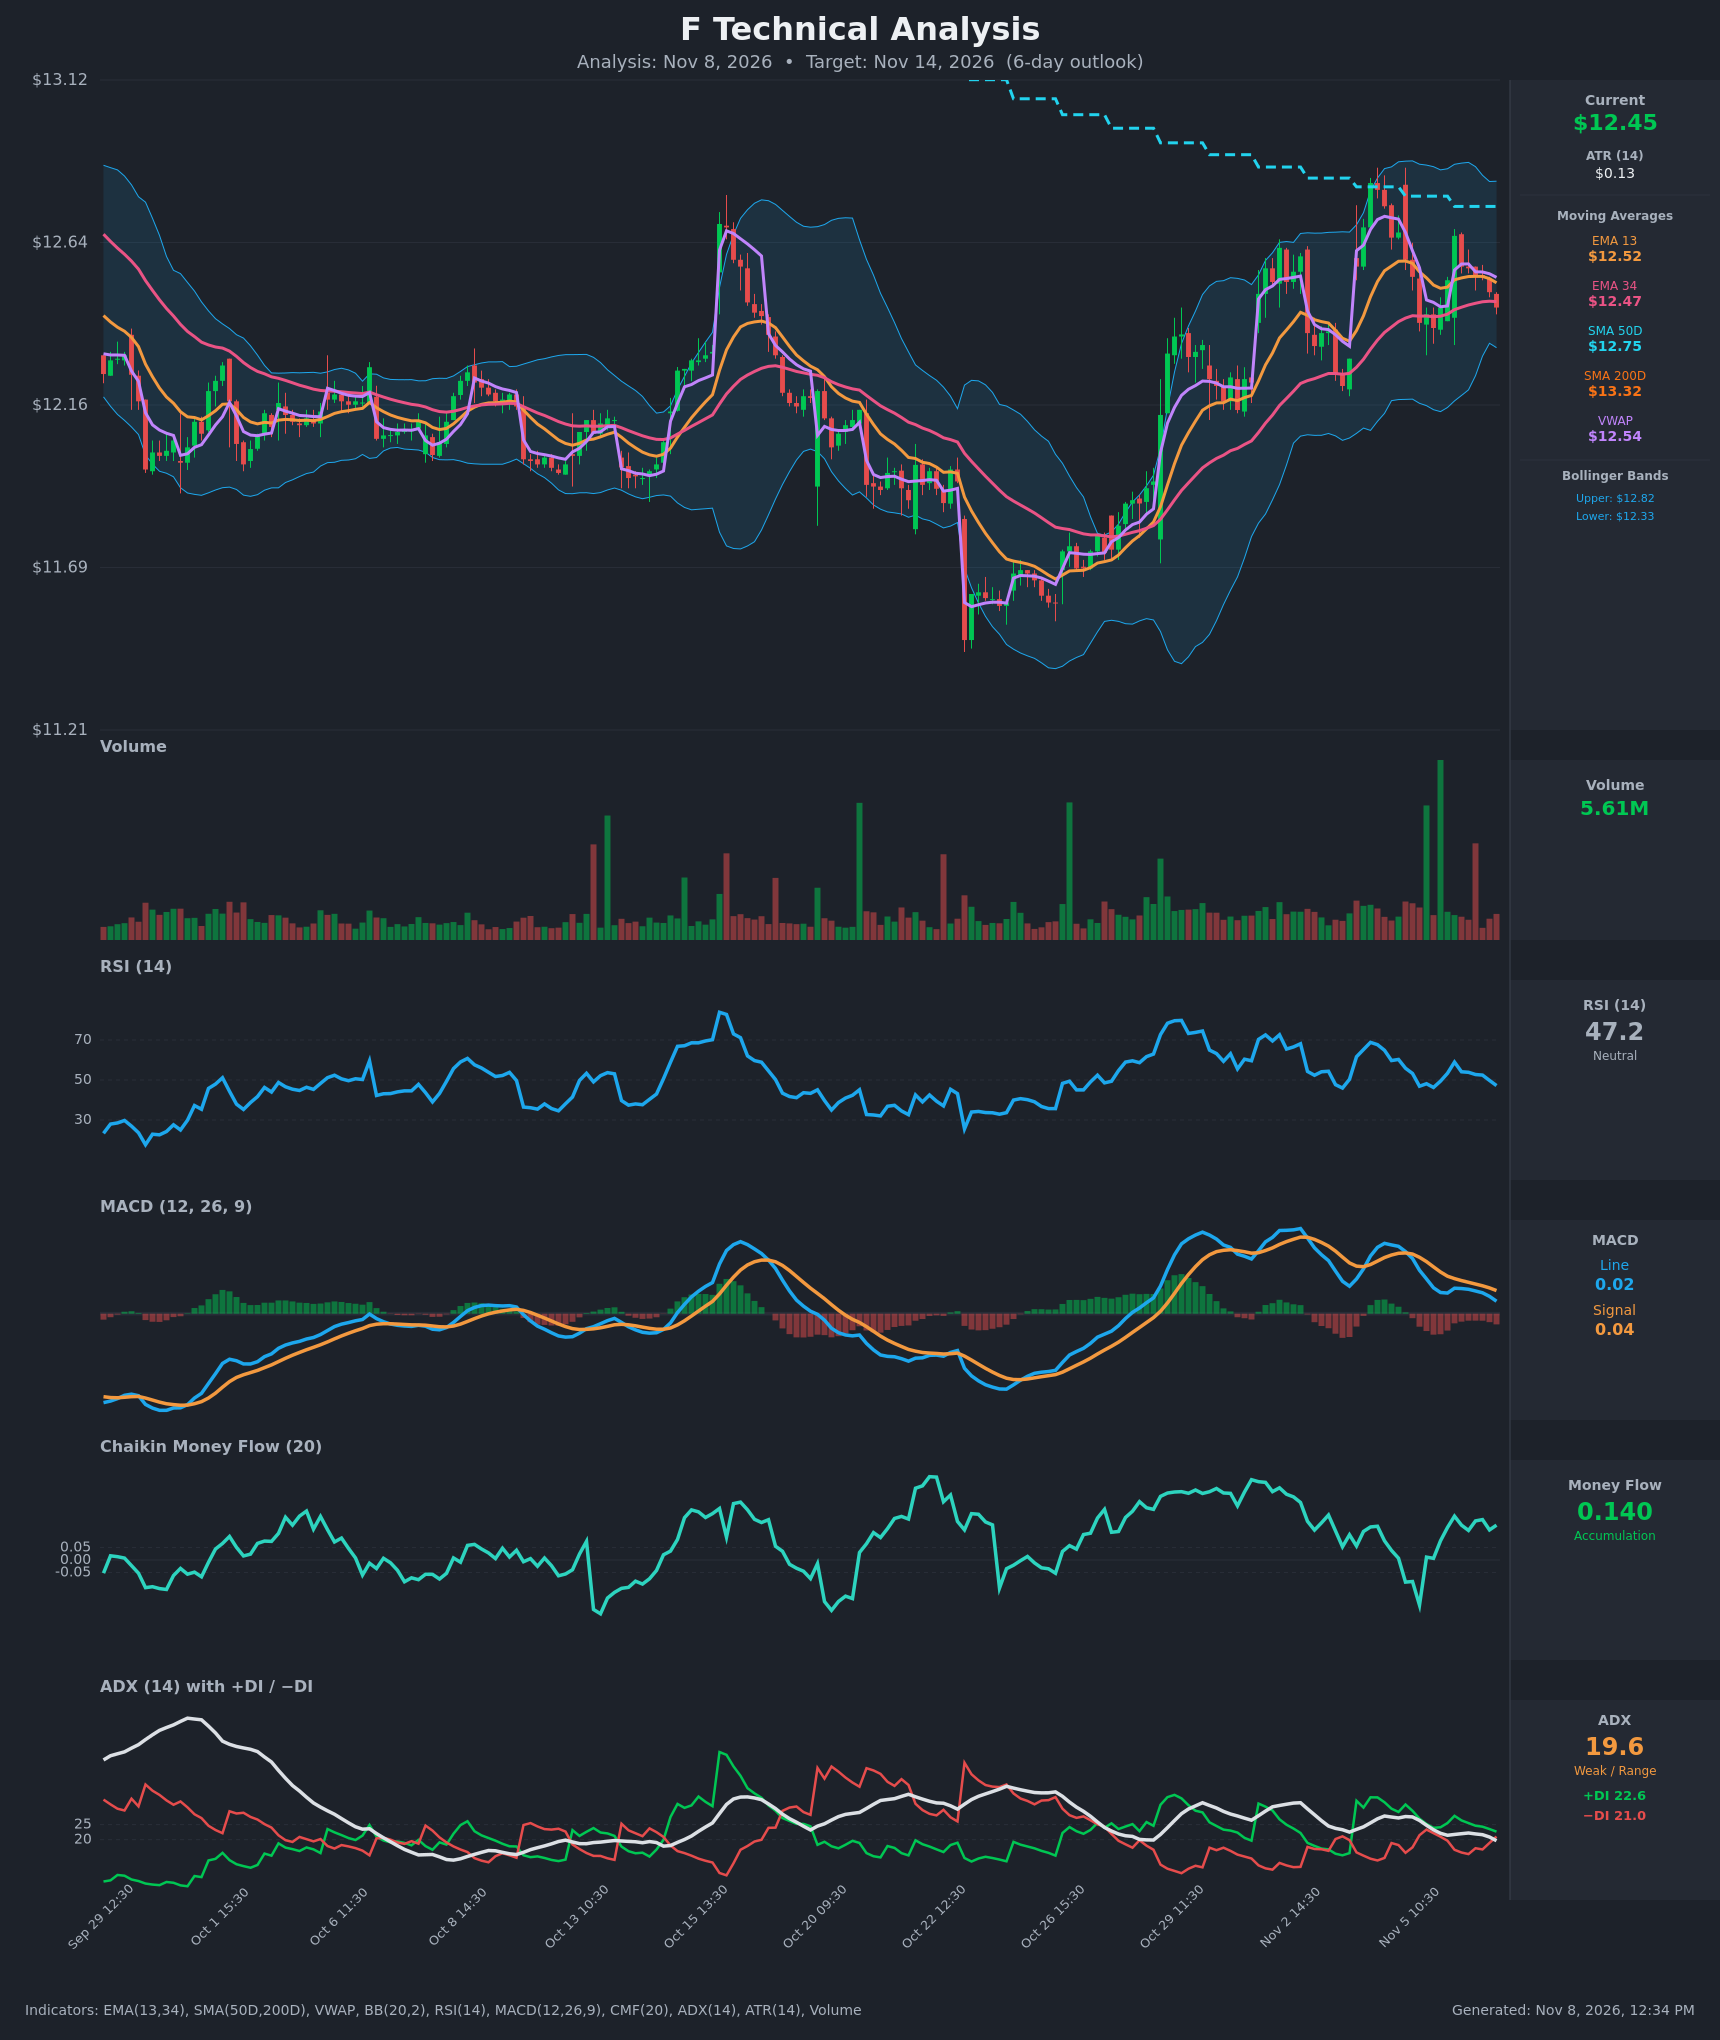
- RSI (14): 47.21, down from 59 on Nov 6 morning and sitting just under the 50 midline. Momentum is fading but not oversold. [Neutral]
- EMA 13 / EMA 34: EMA13 is $12.5226 and EMA34 is $12.4675, so EMA13 is still above EMA34 but the gap has narrowed to about $0.05. Price at $12.45 is below both, so EMA13 is now resistance and EMA34 is the last short-term support. [Bearish]
- MACD: Line 0.0235 is below signal 0.0436, and the histogram is negative. The line crossed under the signal around Nov 5 and has kept falling, so momentum is bearish and still deteriorating. [Bearish]
- Bollinger Bands (20): Upper $12.8204, lower $12.3323, midline about $12.58. Price is in the lower half, below the midline, with about $0.12 of room to the lower band. The bands are fairly narrow, which points to contained volatility. [Neutral]
- CMF (20): 0.140, above +0.05 and so accumulation, though it is off its recent highs and choppy. Buying pressure has been present on dips, which limits the downside. [Accumulation]
- ADX (14): 19.6, below 20, so the trend is weak and range-bound. +DI is 22.6 and −DI is 21.0. Bulls are barely on top, and the gap has closed from 29 vs 18 on Nov 4. The trend has faded, with a bearish tilt developing. [Weak Trend, neutral to slightly bearish]
- Volume: 5.61M, around average, with no spike on the pullback from $12.66. The decline is orderly and not panicked, with no strong conviction either way. [Neutral]
- VWAP / SMAs: Price is below VWAP ($12.5385), SMA50 ($12.7464) and SMA200 ($13.3150). The SMA50 is below the SMA200, so the death cross stays in force and the long-term trend is down. [Bearish]
DIVERGENCES & TRENDS
- There is no clear divergence between price and RSI or MACD. Both oscillators have rolled over in step with price off the ~$12.80 high.
- There is a mild divergence between CMF (positive, accumulation) and price/MACD (weakening). This suggests dips are being bought, so the pullback may be shallow.
- The MACD bearish crossover (line under signal) came after a failed push higher, and the histogram is still negative.
- ADX has dropped from 27 to 19.6 and the DIs are converging, which means the Nov 3–4 up-leg has lost its trend strength. A −DI cross above +DI would confirm sellers taking over.
- Price lost EMA13 and VWAP and is now testing EMA34 ($12.4675). A hold would keep the range intact. A close below would open the lower Bollinger Band.
- The rally from ~$11.50 to ~$12.80 ran into the declining SMA50 ($12.75) and the SMA200 far overhead ($13.32). Both act as overhead resistance.
CHART PATTERNS
- Possible Bearish Double Top (tentative): Two highs near $12.75–$12.80 in early November, with a neckline near $12.40–$12.45. Price is sitting right on that neckline. A confirmed break implies a measured move of roughly $0.35–$0.40 toward $12.05–$12.10, but within 6 days only a partial move toward the lower Bollinger Band is realistic.
- Bearish Flag / sideways drift: After the strong advance, price is making lower highs and consolidating in the $12.40–$12.66 band. This resolves lower on a break below $12.33.
- Range context: Weak ADX and narrow Bollinger Bands also fit a consolidation between $12.33 and $12.66. The pattern evidence is not decisive, so a break of either boundary will set direction.
POTENTIAL SCENARIOS
- Scenario 1: Bearish Neckline Break and Drift to Lower Band — MACD is below its signal, price is below the EMA13 and VWAP, and the DIs are converging toward a bearish cross. Price loses EMA34 and the $12.40 neckline and drifts toward the lower Bollinger Band. Trigger: hourly close below $12.40 with −DI crossing above +DI. Target: $12.30–$12.36, with an extension to $12.15 if the lower band fails. Invalidation: hourly close above $12.55 (EMA13/VWAP). (45% probability)
- Scenario 2: Neutral Range-Bound Chop — Weak ADX and positive CMF keep price oscillating around the EMA34 within $12.33–$12.60. Trigger: price holds $12.33–$12.40 on declining volume. Target: $12.42–$12.55. Invalidation: close outside $12.30–$12.65. (25% probability)
- Scenario 3: Bullish Bounce Back to VWAP and SMA50 — Accumulation (CMF 0.14) lifts price off the EMA34 and the lower band area. Price reclaims the EMA13 and VWAP and retests the upper range. Trigger: close above $12.55 with MACD histogram turning up. Target: $12.66–$12.75. Invalidation: close below $12.33. (30% probability)
PRICE TARGETS
- Target Price: $12.36 (6-day horizon)
- Expected Range: $12.00 to $12.75 (width $0.75, about 6.0% of the current price, which fits the 7–10 day guideline scaled down for 6 days)
- Key Levels: Support at $12.33 (lower Bollinger Band), Resistance at $12.54 (VWAP / EMA13 zone)
OVERALL BIAS
OVERALL BIAS: BEARISH - Price has lost the EMA13 and VWAP with MACD below its signal, RSI rolling over below 50, and the DIs converging. It remains below the declining SMA50 and SMA200, so sellers have the edge. Positive CMF and weak ADX argue for a shallow decline toward the lower Bollinger Band near $12.33 rather than a steep drop.
This is educational analysis and not financial advice.