AMD 6-day bullish forecast — Nov 8, 2026
- Bias: Bullish
- Timeframe: 6 days (made Nov 8, 2026, target date Nov 13, 2026)
- Price at analysis: $449.03
- Price target: $458.00
- Expected range: $435.00 – $468.00
- Result: Correct (+16.2%) — closed at $521.65 on Nov 13, 2026; quality score 50/100
Get a free AI analysis of AMD today
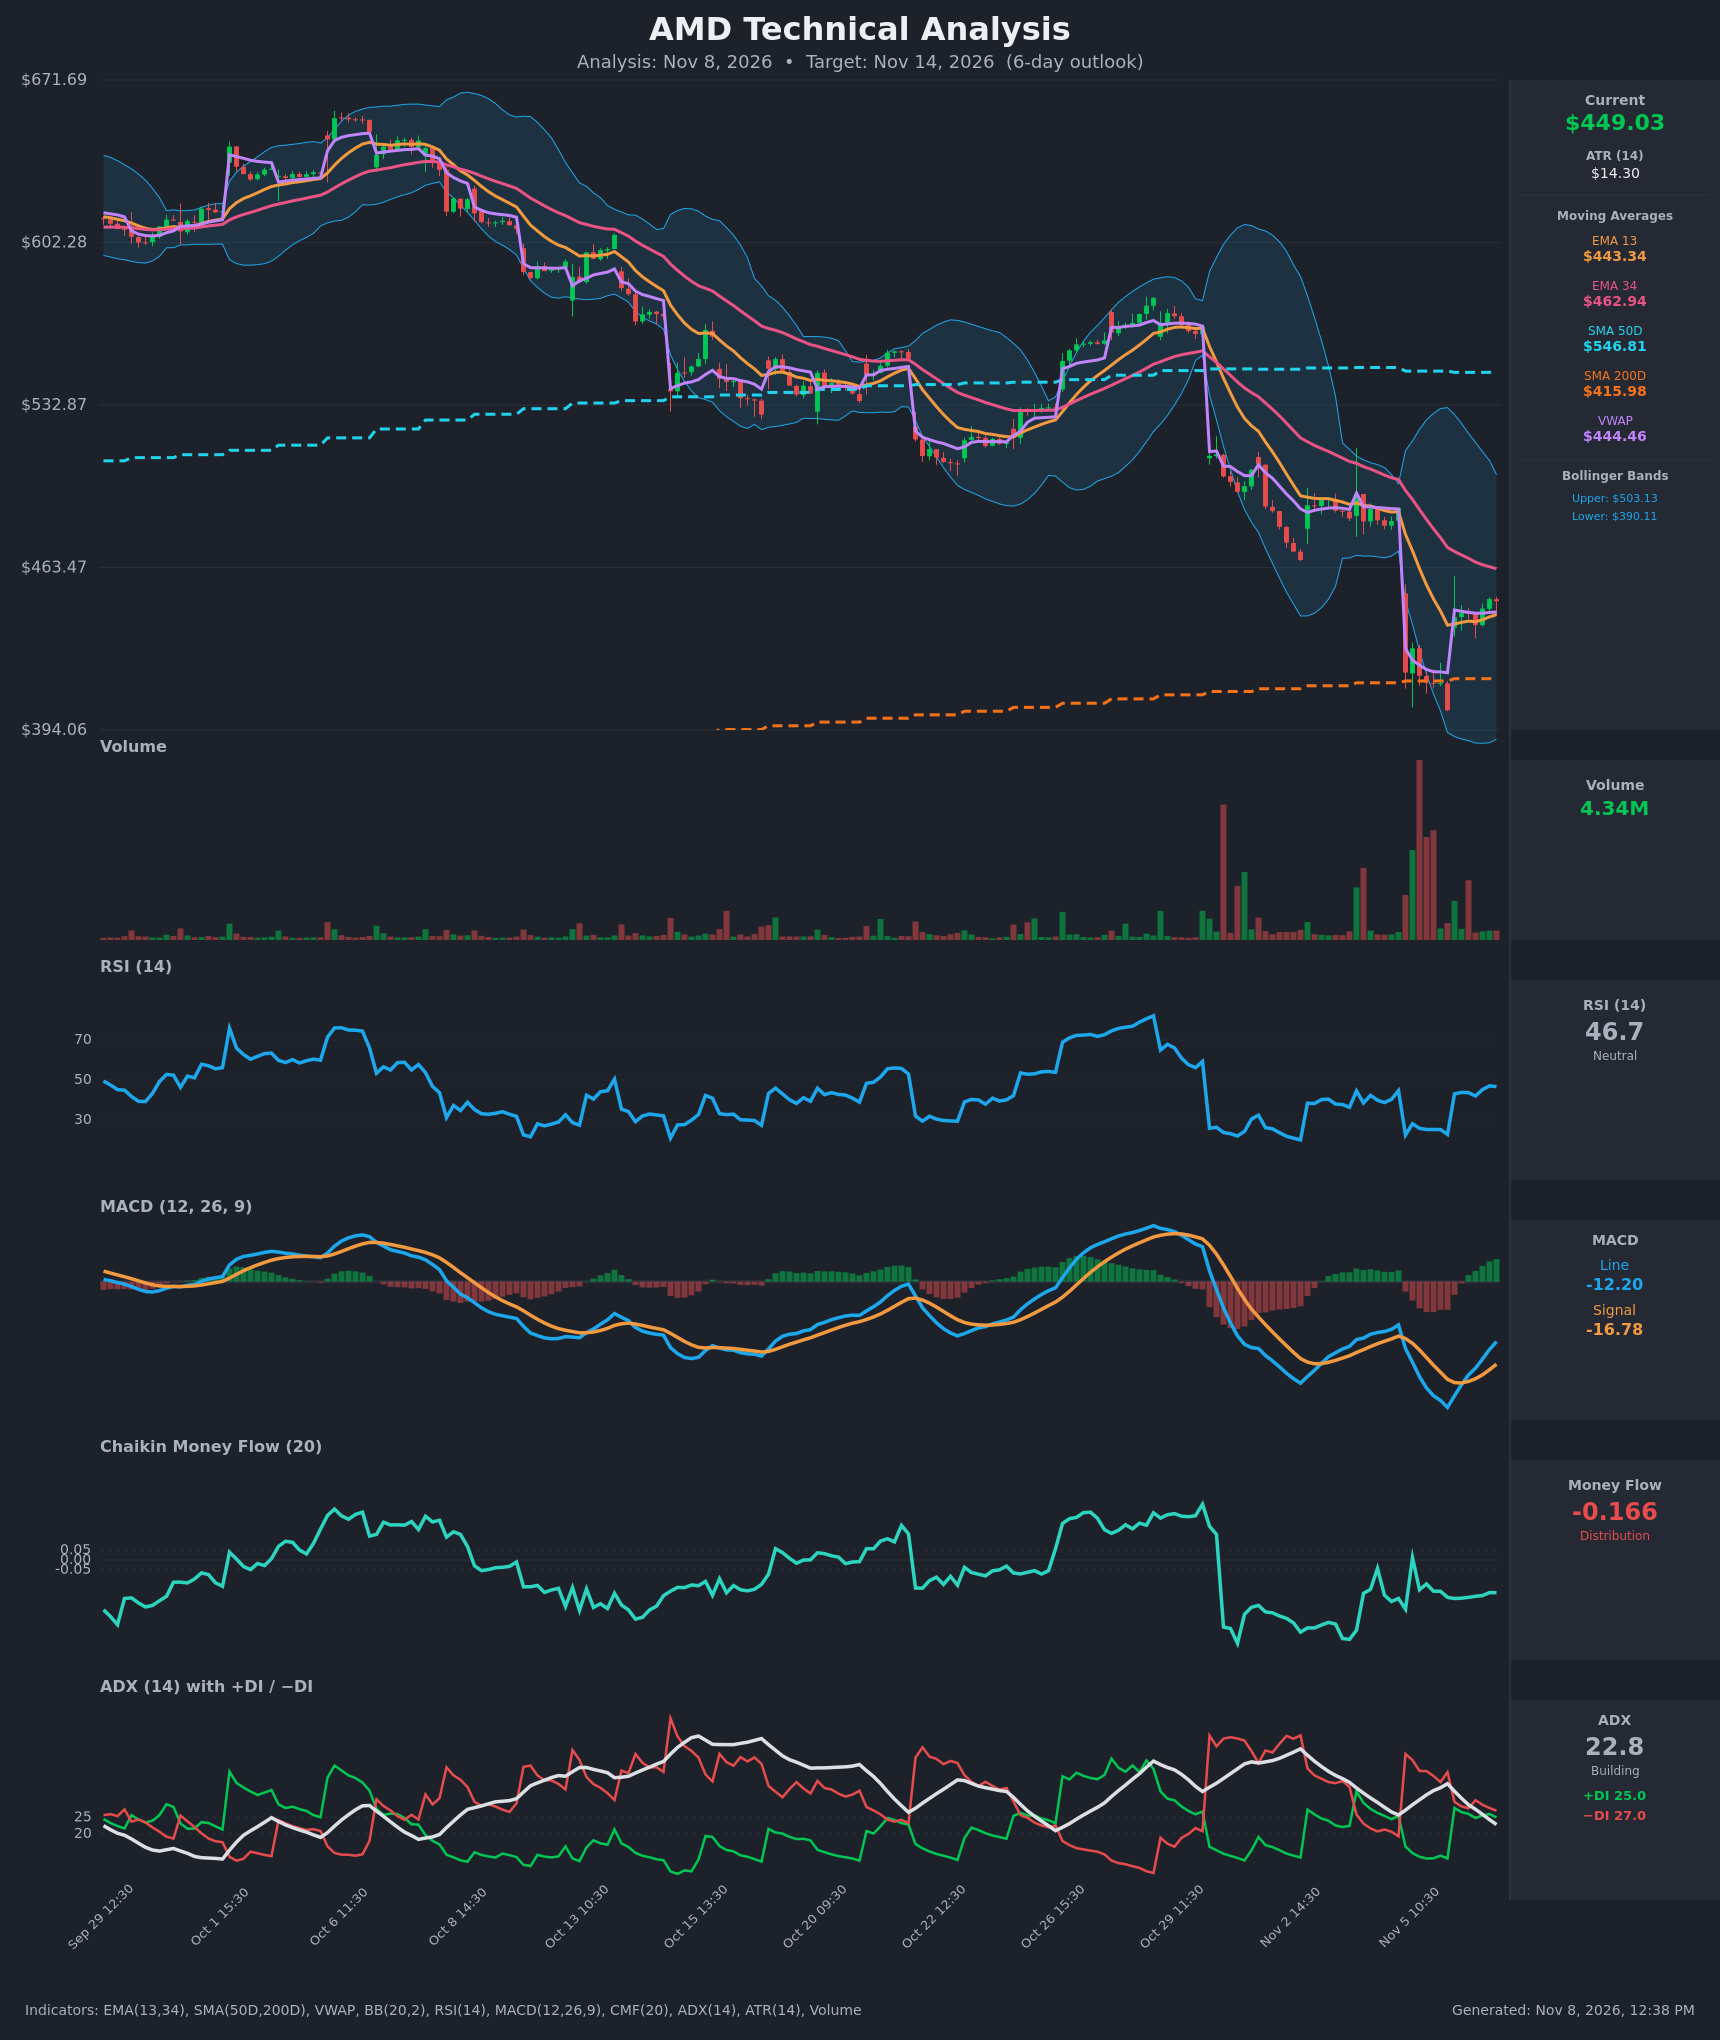
Analysis
TECHNICAL INDICATORS
- RSI (14): 46.67, recovering from deeply oversold readings of about 22-25 on Nov 5 and now back near the midline. Momentum is improving but not yet above 50. [Neutral]
- 20 EMA: The data gives EMA 13 at $443.34 and EMA 34 at $462.94. Price ($449.03) is above the EMA 13, which is acting as short-term support, but below the EMA 34, which is overhead resistance. EMA 13 is still far below EMA 34, so the bearish alignment persists. [Neutral]
- MACD: Line -12.20 is above the signal at -16.78, so the histogram is positive and rising. The bullish crossover happened on Nov 6 at 10:30. Both lines remain below zero, so this is a relief bounce within a larger downtrend. [Bullish]
- Bollinger Bands (20): Upper $503.13, lower $390.11, midline about $446.6. Price is sitting almost exactly on the midline after bouncing from the lower band. The bands are very wide after the gap-down, which signals elevated volatility. [Neutral]
- CMF (20): -0.166, well below -0.05 and negative throughout the chart's recent stretch. Selling pressure still dominates, and the bounce has not drawn accumulation. [Distribution]
- ADX (14): 22.8 and falling from a peak of 35, so the selloff's trend strength is fading. -DI (27.0) is only narrowly above +DI (25.0), and a bullish DI crossover is close. [Weak Trend, slight bearish tilt]
- Volume: 4.34M on the latest bar, far below the capitulation spike on the gap-down. Volume has dried up during the bounce, which suggests sellers are exhausted but buyers are not yet committed. [Neutral/Exhaustion of selling]
DIVERGENCES & TRENDS
- RSI made a low of about 22.5 on Nov 5, and the MACD line bottomed at about -25.6. MACD has since turned up sharply while price holds a higher low, a mild bullish momentum improvement. This is not a clean divergence.
- MACD crossed above its signal line on Nov 6 at 10:30, and the histogram has expanded for several bars.
- EMA 13 is flattening and turning up, while EMA 34 still slopes down. A bullish EMA cross is not imminent.
- Price has held above SMA200D ($415.98), while SMA50D ($546.81) is well above price. The death cross has already occurred, since the SMA50D sat below the SMA200D range earlier.
- ADX is falling, and the DI spread has narrowed from -DI 44 vs +DI 16 to a nearly even 27 vs 25. Bearish control is fading.
- CMF has not confirmed the bounce, which is a warning flag.
- Price is just above VWAP ($444.46), a marginally positive signal.
CHART PATTERNS
- Tight consolidation after a gap-down (Bearish Flag/Pennant, continuation): Price has formed a small base in the $438-$450 range after a sharp drop. If this resolves lower, the measured move points toward and below the SMA200 at about $416, then lower.
- Bullish Falling Wedge / base at SMA200D (reversal): The capitulation low near $402 was followed by a higher low and a rising MACD, which fits an early reversal attempt. A close above the EMA 34 (about $463) would confirm it, with a target near the $490 gap zone.
- The base is too small to be reliable, so I treat both patterns as tentative. The bullish resolution has slightly more support from momentum.
POTENTIAL SCENARIOS
- Scenario 1: Bullish Relief Rally Toward EMA 34 — The MACD crossover, the recovering RSI and the SMA200 support hold. Price grinds up toward the EMA 34 and the upper part of the post-gap range. Trigger: hold above $443 (EMA 13/VWAP) and a push through $452. Target: $458-$465, with an extension to about $475. Invalidation: a close below $438. (50% probability)
- Scenario 2: Bearish Rejection and Retest of Lows — Distribution (CMF -0.166) and the downtrend resume, and the bounce fails at the EMA 34 or -DI regains control. Trigger: a break below $438-$440 and VWAP. Target: $415-$420 (SMA200 zone), and possibly a retest of $402. Invalidation: a close above $465. (35% probability)
- Scenario 3: Neutral Chop — Price oscillates around the EMA 13, VWAP and the Bollinger midline while ADX stays below 25. Trigger: no break of $438 or $463. Target: $440-$455. Invalidation: a break of either range boundary on volume. (15% probability)
PRICE TARGETS
- Target Price: $458.00 (6-day)
- Expected Range: $435.00 to $468.00 ($33 width, about 7.3% of current price, appropriate for 6 days and consistent with ATR scaling)
- Key Levels: Support at $443.34 (EMA 13; below that, the $438 consolidation low and $415.98 SMA200), Resistance at $462.94 (EMA 34)
OVERALL BIAS
OVERALL BIAS: BULLISH - A MACD bullish crossover, RSI recovering from oversold, and price holding above the EMA 13, VWAP and SMA200 favor a modest relief bounce toward the EMA 34. Conviction is limited by persistent CMF distribution, the downtrend below the EMA 34 and SMA50, and the narrow -DI lead.
This is educational analysis and not financial advice.