XLF 4-day bearish forecast — Nov 8, 2026
- Bias: Bearish
- Timeframe: 4 days (made Nov 8, 2026, target date Nov 11, 2026)
- Price at analysis: $57.16
- Price target: $56.75
- Expected range: $55.65 – $58.00
- Result: Incorrect (+2.8%) — closed at $58.77 on Nov 11, 2026; quality score 25/100
Get a free AI analysis of XLF today
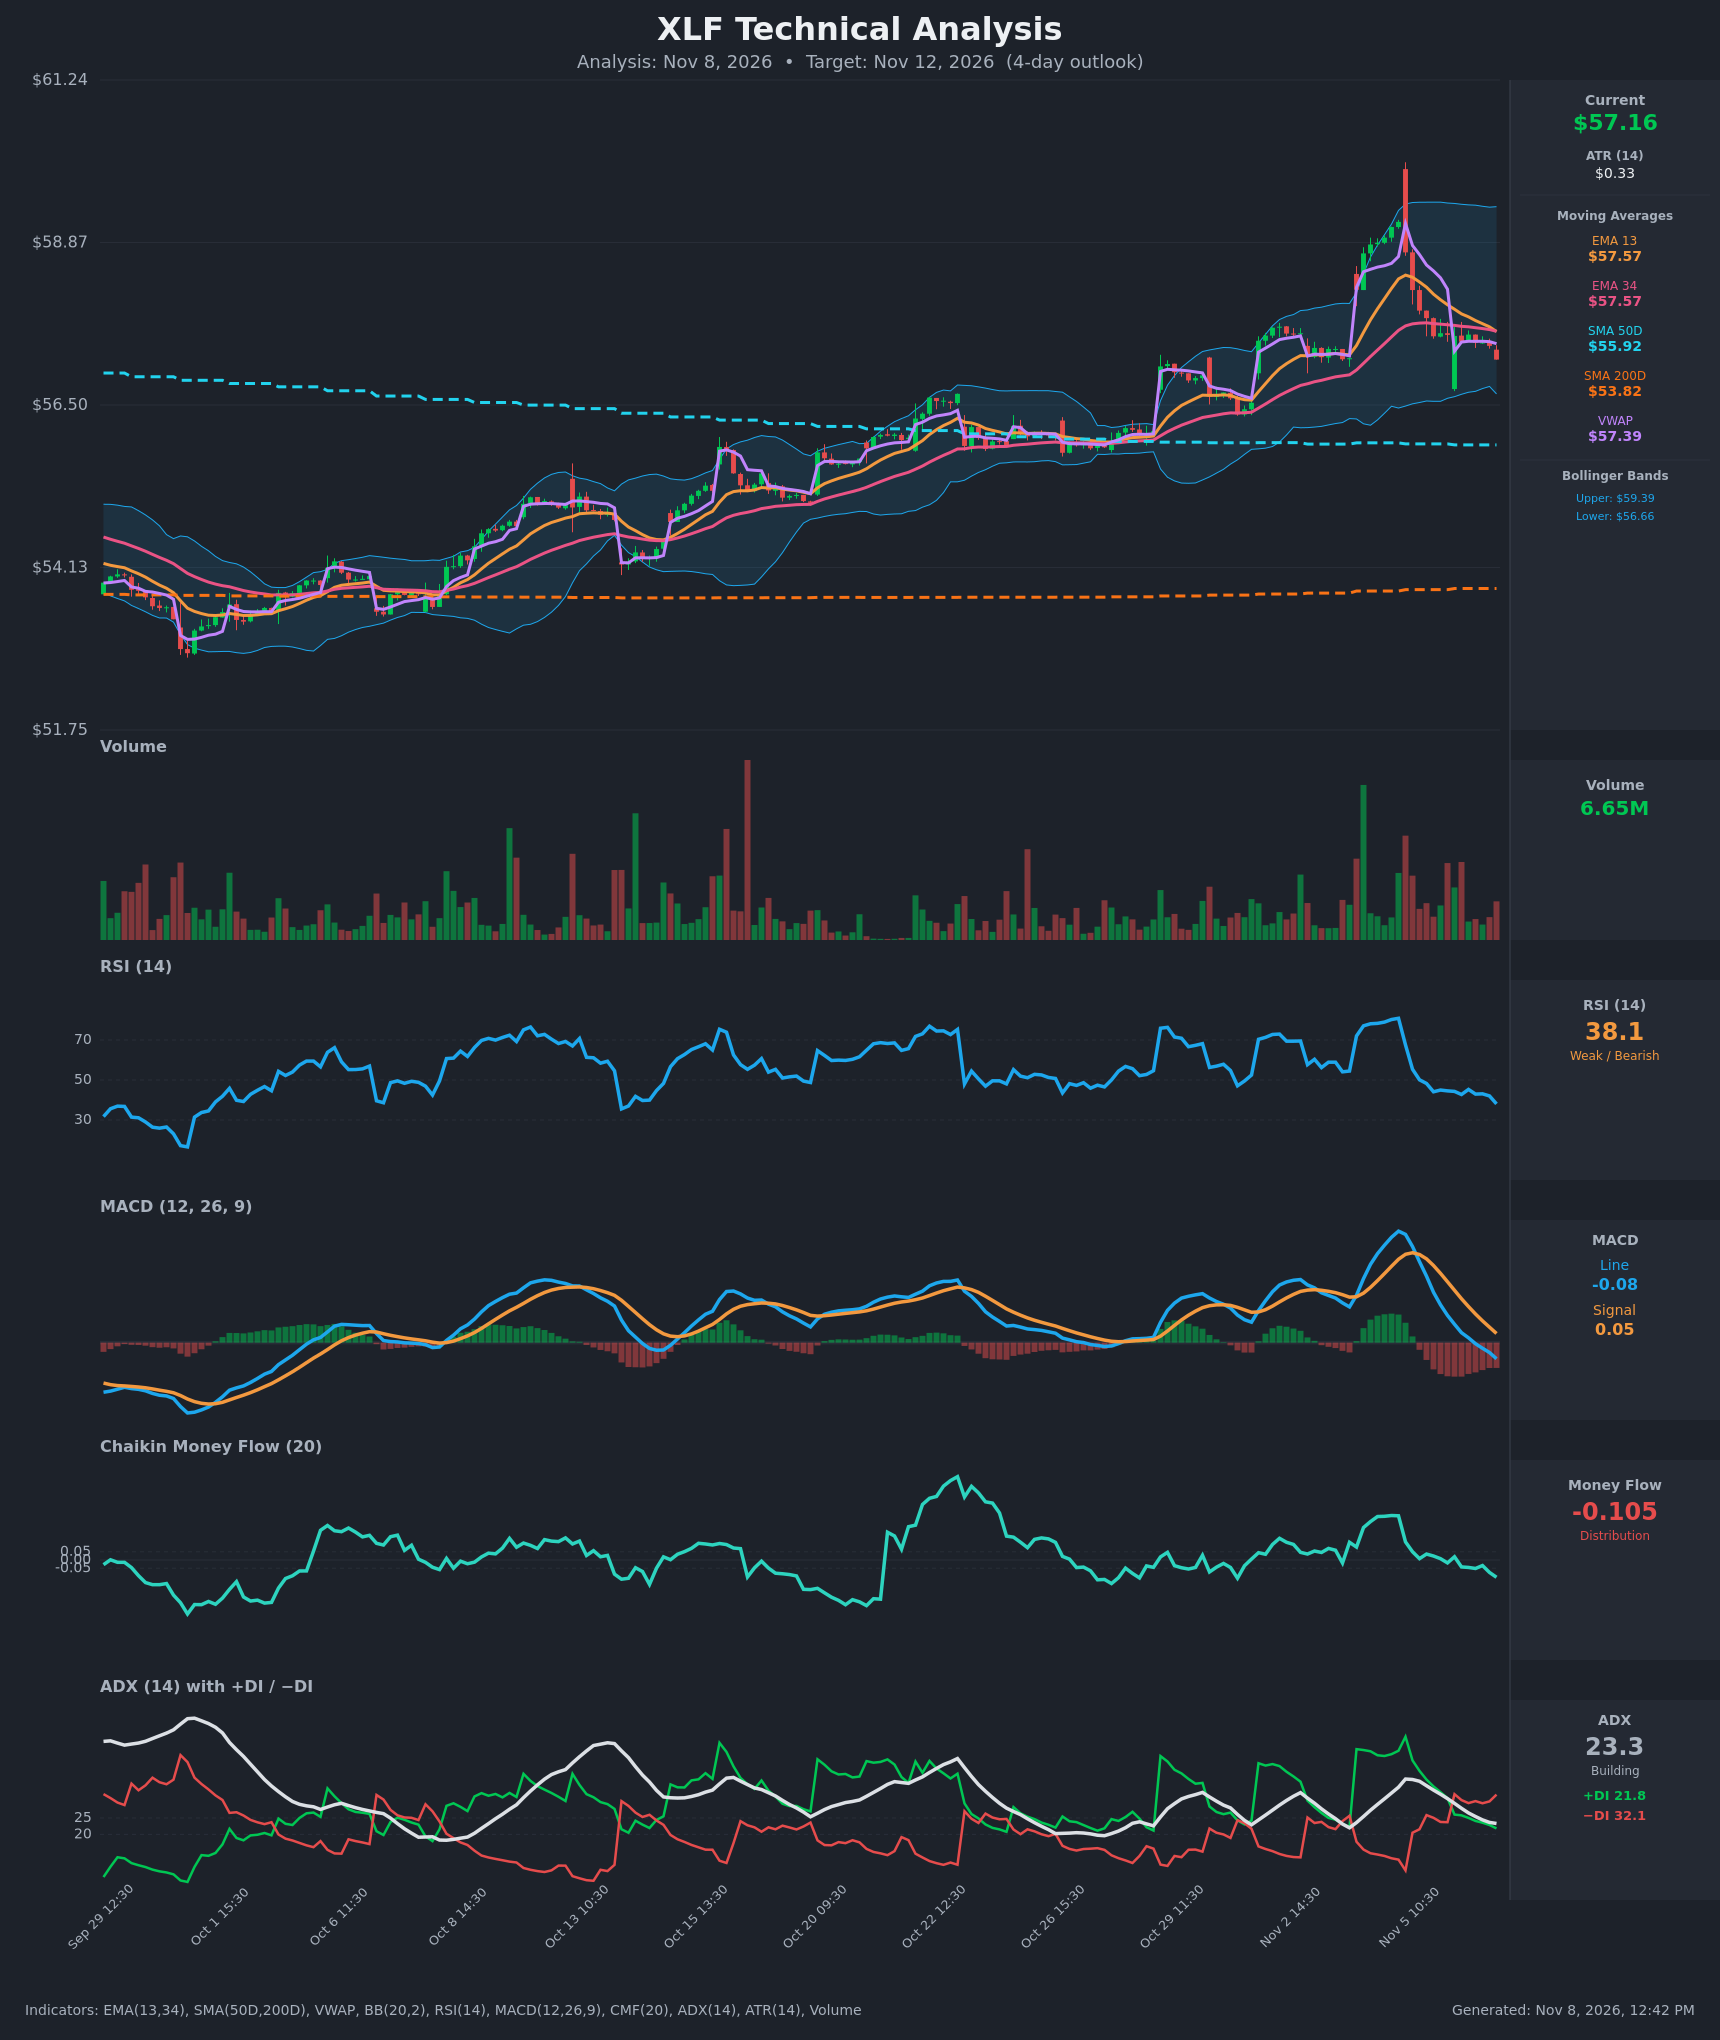
Analysis
TECHNICAL INDICATORS
- RSI (14): 38.05, down from 80.9 on Nov 4 and now approaching oversold (30). Momentum is clearly falling and has not yet shown a bottoming turn. [Bearish]
- EMA 13/34 (labelled 20 EMA in the template): EMA13 $57.57 and EMA34 $57.57 have just converged, with EMA13 crossing down toward EMA34 after being well above it ($58.34 vs $57.59 on Nov 4). Price at $57.16 sits below both, so they act as overhead resistance. [Bearish]
- MACD: Line -0.085 crossed below Signal 0.048 (around Nov 6 12:30) and the histogram is negative, about -0.13 and widening. Both lines are falling from the early-Nov peak. [Bearish]
- Bollinger Bands (20): Upper $59.39, lower $56.66, so price sits in the lower third of the band, about $0.50 above the lower band. The bands are wide after the Nov 4 spike, and price is drifting toward the lower band. That raises the odds of a lower-band test, though not a breakdown yet. [Bearish]
- CMF (20): -0.105, down from +0.268 and negative for most of the last 8 bars. This is distribution/selling pressure. [Distribution]
- ADX (14): 23.3 and falling from 36.9, with −DI 32.1 above +DI 21.8. The −DI crossover happened on Nov 6. The trend is moderate and weakening, but bears are in control. [Weak/Moderate Trend, Bearish direction]
- Volume: 6.65M, roughly average, with no capitulation spike on the pullback. Selling is orderly rather than panicked, and there is no sign of a climactic washout. Price is also below VWAP ($57.39). [Neutral-to-Bearish]
DIVERGENCES & TRENDS
- There is no bullish RSI or MACD divergence yet. RSI is making lower highs and lower lows alongside price.
- The Nov 4 spike to $59.17 was a blow-off. RSI hit 80.9 and then collapsed, and price has given back all of it.
- A bearish EMA13/EMA34 convergence is underway, and a cross lower looks imminent.
- The MACD bearish crossover and the −DI over +DI crossover both confirm short-term weakness.
- The longer-term structure is still bullish: price is above SMA50 ($55.92) and SMA200 ($53.82), and SMA50 is above SMA200. This is a pullback within a larger uptrend, so SMA50 is the main downside magnet.
- Price is also below VWAP, which shows intraday sellers in control.
CHART PATTERNS
- Bearish Head and Shoulders / Double Top (loose): The Nov 4 spike followed by the lower-high rollover resembles a short-term blow-off top, and neckline support is around the $57.2–57.4 consolidation. That level is now being broken, with price at $57.16.
- Bearish flag/pennant (loose): The tight $57.36–57.52 sideways range on Nov 5–6 afterglow the sharp drop. Its break to the downside points to a measured move toward ~$56.6–56.7, which is also the lower Bollinger Band.
- Larger picture: The higher-low uptrend since Sep 29 remains intact, with an earlier support shelf around $56.0–56.3 (the late-Oct breakout zone) and SMA50 at $55.92.
POTENTIAL SCENARIOS
- Scenario 1: Bearish Continuation Toward Lower Band — MACD and DI crossovers, a consolidation breakdown and CMF distribution point to a drift down to the lower Bollinger Band. Trigger: sustained trade below $57.10 with EMA13 crossing below EMA34. Target: $56.55–56.70, with an extension to $56.20. Invalidation: close back above $57.60 (EMAs/VWAP). (55% probability)
- Scenario 2: Neutral Consolidation/Base — RSI approaching oversold and the rising SMA50 below attract dip buyers, so price chops between $56.70 and $57.50. Trigger: hold of $56.80 with RSI stabilising in the 30s. Target: $57.00–57.30. Invalidation: break of $56.60 or above $57.70. (25% probability)
- Scenario 3: Bullish Rebound — An oversold bounce reclaims the EMAs and VWAP. Trigger: move above $57.60 on rising volume. Target: $58.00–58.30. Invalidation: failure at $57.60 and a rollover back under $57.10. (20% probability)
PRICE TARGETS
For a 4-day horizon, with ATR $0.33 (√4 × ATR ≈ $0.67 one-sigma), I use a range of about 5.3% of price.
- Target Price: $56.75 (4 days from now)
- Expected Range: $55.65 to $58.00 (width $2.35, ≈4.1% of price, in line with the 4–8% guidance for short horizons; slightly tight for 7–10 days but appropriate for 4 days given ATR)
- Key Levels: Support at $56.66 (lower Bollinger Band; next at SMA50 $55.92), Resistance at $57.57 (EMA13/EMA34 confluence; next VWAP $57.39 and $58.00)
OVERALL BIAS
OVERALL BIAS: BEARISH - MACD bearish cross, −DI above +DI, negative CMF at -0.105, price below the EMAs and VWAP, and RSI still falling together point to a drift toward the $56.66 lower band. The long-term uptrend above SMA50/SMA200 limits the downside, so a pullback rather than a collapse is expected.
This is educational analysis and not financial advice.