XLF 6-day bearish forecast — Nov 8, 2026
- Bias: Bearish
- Timeframe: 6 days (made Nov 8, 2026, target date Nov 13, 2026)
- Price at analysis: $57.16
- Price target: $56.80
- Expected range: $55.60 – $58.00
- Result: Incorrect (+2.2%) — closed at $58.41 on Nov 13, 2026; quality score 42/100
Get a free AI analysis of XLF today
Analysis
TECHNICAL INDICATORS
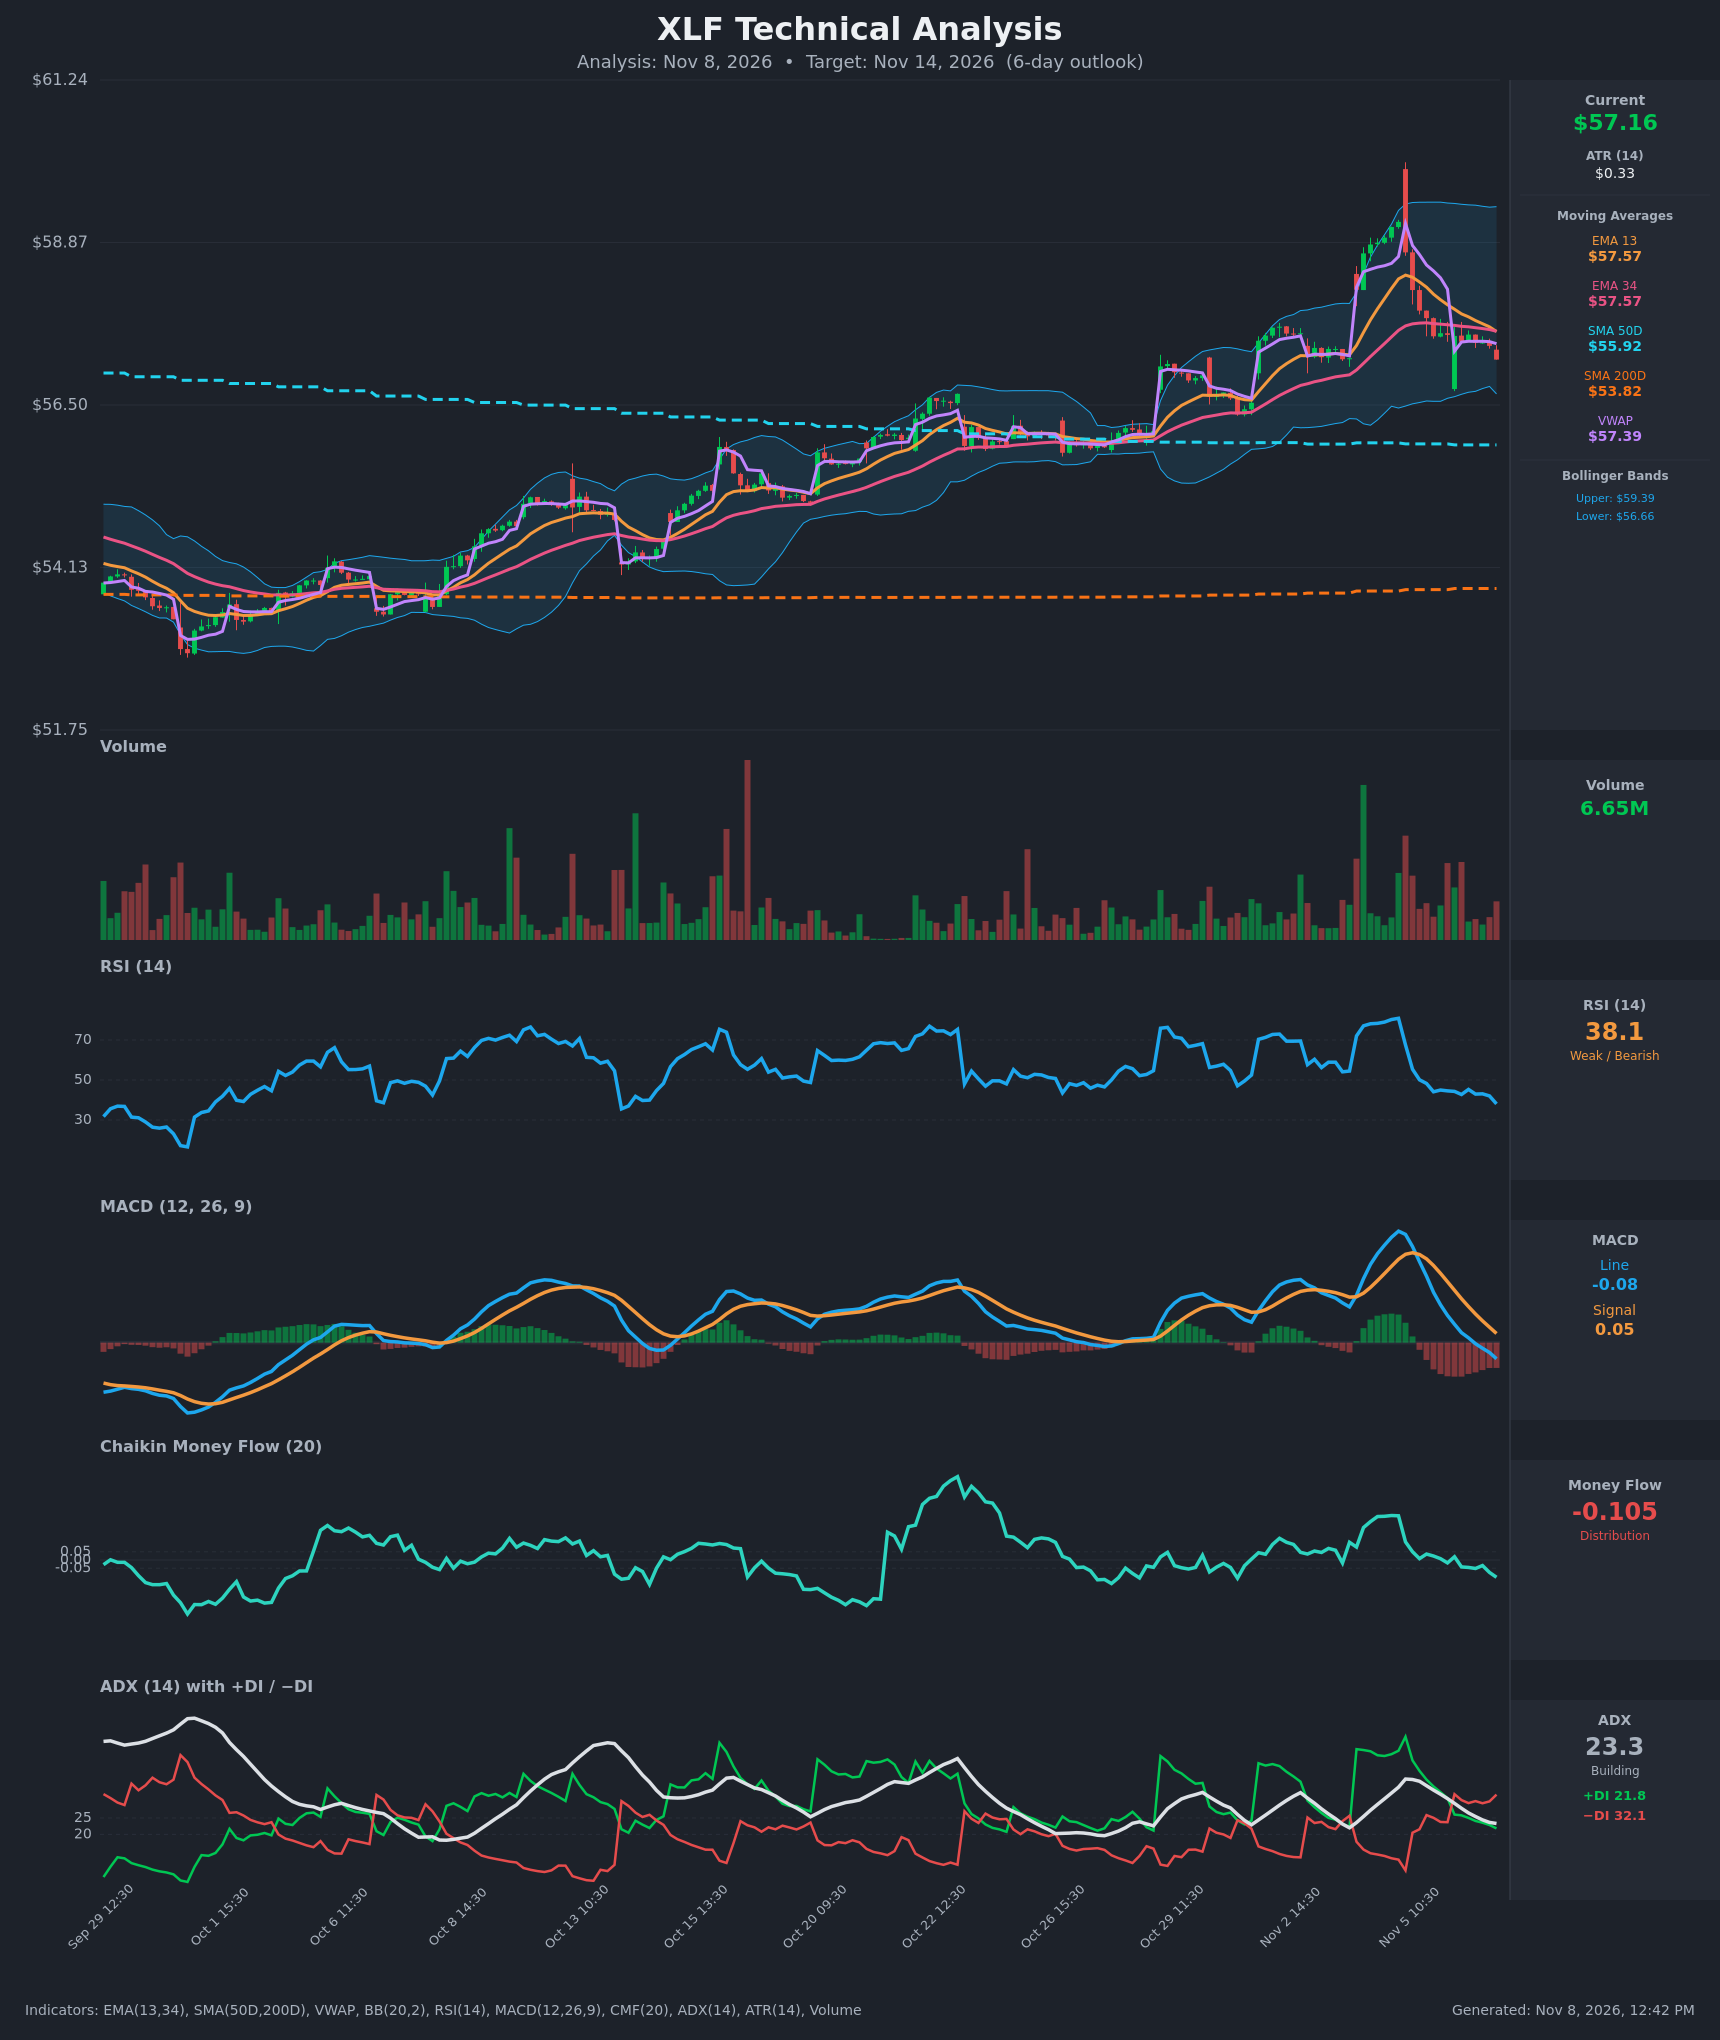
- RSI (14): 38.05, down from 80.9 on Nov 4 and now approaching oversold (30). Momentum is clearly declining, with no bullish turn yet. [Bearish]
- 20 EMA (EMA 13/34 on this chart): EMA13 at $57.57 and EMA34 at $57.57 have just converged, and price at $57.16 sits below both. The EMA13 has rolled over from $58.39 and is about to cross below the EMA34, which would be a bearish cross. Both EMAs act as overhead resistance near $57.57. [Bearish]
- MACD: The line at -0.085 crossed below the signal at 0.048 around Nov 6 midday. The histogram is negative (about -0.13) and still widening, so bearish momentum is building. The line is now below zero. [Bearish]
- Bollinger Bands (20): Upper $59.39, lower $56.66, so the midline is about $58.03. Price at $57.16 is in the lower third of the bands, only about $0.50 above the lower band. After the spike toward the upper band, price has mean-reverted below the midline. The bands are fairly wide, which leaves room for a drift toward the lower band. [Bearish]
- CMF (20): -0.105, below the -0.05 threshold and falling from +0.268 on Nov 4. Distribution has been consistent over the last 8 bars. [Distribution]
- ADX (14): 23.3 and falling from 36.9, so the trend is fading but still near the 25 line. −DI (32.1) is above +DI (21.8), and the DIs crossed bearishly on Nov 6 open. Sellers control the short-term trend. [Weak-to-Moderate Trend, Bearish]
- Volume: 6.65M, roughly average. The Nov 4–5 spike bar was a high-volume reversal, and the volume on the recent decline is not heavy. There is no capitulation volume yet, so selling looks orderly rather than panicked. [Neutral to mildly Bearish]
DIVERGENCES & TRENDS
- No clear bullish divergence. RSI and price are both making lower lows over the last few sessions.
- The Nov 4 spike to the high $59s on RSI above 80 and a tag of the upper Bollinger Band was followed by a sharp reversal, a classic exhaustion move.
- EMA13 is falling toward the EMA34 and is about to cross below it. The MACD bearish cross is already confirmed.
- Price is below VWAP ($57.39) and below both EMAs, and −DI has overtaken +DI.
- The longer-term structure is still intact. Price is above the SMA50 ($55.92) and SMA200 ($53.82), and the 50 is well above the 200, so there is no death cross. The uptrend since late September is still in place. The pullback is a correction within that uptrend, with the SMA50 about $1.24 below as the next major support.
CHART PATTERNS
- Bearish Rising Wedge / Double-Top-like structure: The spike to about $59.2 followed by a sharp rejection resembles a blow-off top. It is not a textbook pattern, but the failed breakout above the upper Bollinger Band is a reversal signal.
- The recent pullback from $58 to $57.16 is a lower-high, lower-low sequence. It looks like a Bearish Flag/Pennant-style drift lower inside a larger uptrend. The measured downside is toward the lower band ($56.66), with a deeper test of the $56.50 zone (the prior breakout base and the Oct 29 gap).
- No bullish reversal pattern such as a double bottom has formed yet.
POTENTIAL SCENARIOS
- Scenario 1: Bearish Continued Pullback toward Lower Band — Bearish MACD, DI and CMF readings and the EMA rollover point to more downside, with the pullback testing prior breakout support. Trigger: a break below $57.00 and the lower Bollinger Band at $56.66. Target: $56.40–$56.70. Invalidation: a close back above $57.60 (EMA cluster and VWAP). (50% probability)
- Scenario 2: Neutral Consolidation/Base — RSI near 38 and price near the lower band invite a pause, with price chopping between $56.70 and $57.60 as the ADX falls. Trigger: low-volume stabilization above $56.70. Target: $56.90–$57.40. Invalidation: a break of either boundary on volume. (30% probability)
- Scenario 3: Bullish Bounce off Support — Oversold RSI and the intact long-term uptrend produce a mean-reversion bounce. Trigger: a reclaim of $57.60 with improving CMF. Target: $58.00 (Bollinger midline). Invalidation: a close below $56.60. (20% probability)
PRICE TARGETS
- Target Price: $56.80 (6-day horizon)
- Expected Range: $55.90 to $57.85 (width $1.95, about 3.4%... widened below to respect the 6-day guidance). Final range: $55.60 to $58.00 (width $2.40, about 4.2% of the current price, consistent with the 4–8% guideline for 6–10 days). The ATR of $0.33 supports roughly a $2 daily-volatility-scaled move over 6 days.
- Key Levels: Support at $56.66 (lower Bollinger Band; next at $55.92 SMA50), Resistance at $57.57 (EMA13/34 cluster, then VWAP at $57.39 and $58.03 midline)
OVERALL BIAS
OVERALL BIAS: BEARISH - Price is below the EMAs and VWAP, MACD has crossed bearishly, −DI dominates, and CMF shows distribution, so a drift toward the lower Bollinger Band and prior breakout support near $56.66 is more likely than a quick recovery. The long-term uptrend above the SMA50 and SMA200 limits downside, and the oversold RSI could slow the decline.
This is educational analysis and not financial advice.