GOOGL 4-day bearish forecast — Nov 8, 2026
- Bias: Bearish
- Timeframe: 4 days (made Nov 8, 2026, target date Nov 11, 2026)
- Price at analysis: $284.73
- Price target: $282.00
- Expected range: $277.00 – $289.00
- Result: Incorrect (+3.5%) — closed at $294.80 on Nov 11, 2026; quality score 11/100
Get a free AI analysis of GOOGL today
Analysis
TECHNICAL INDICATORS
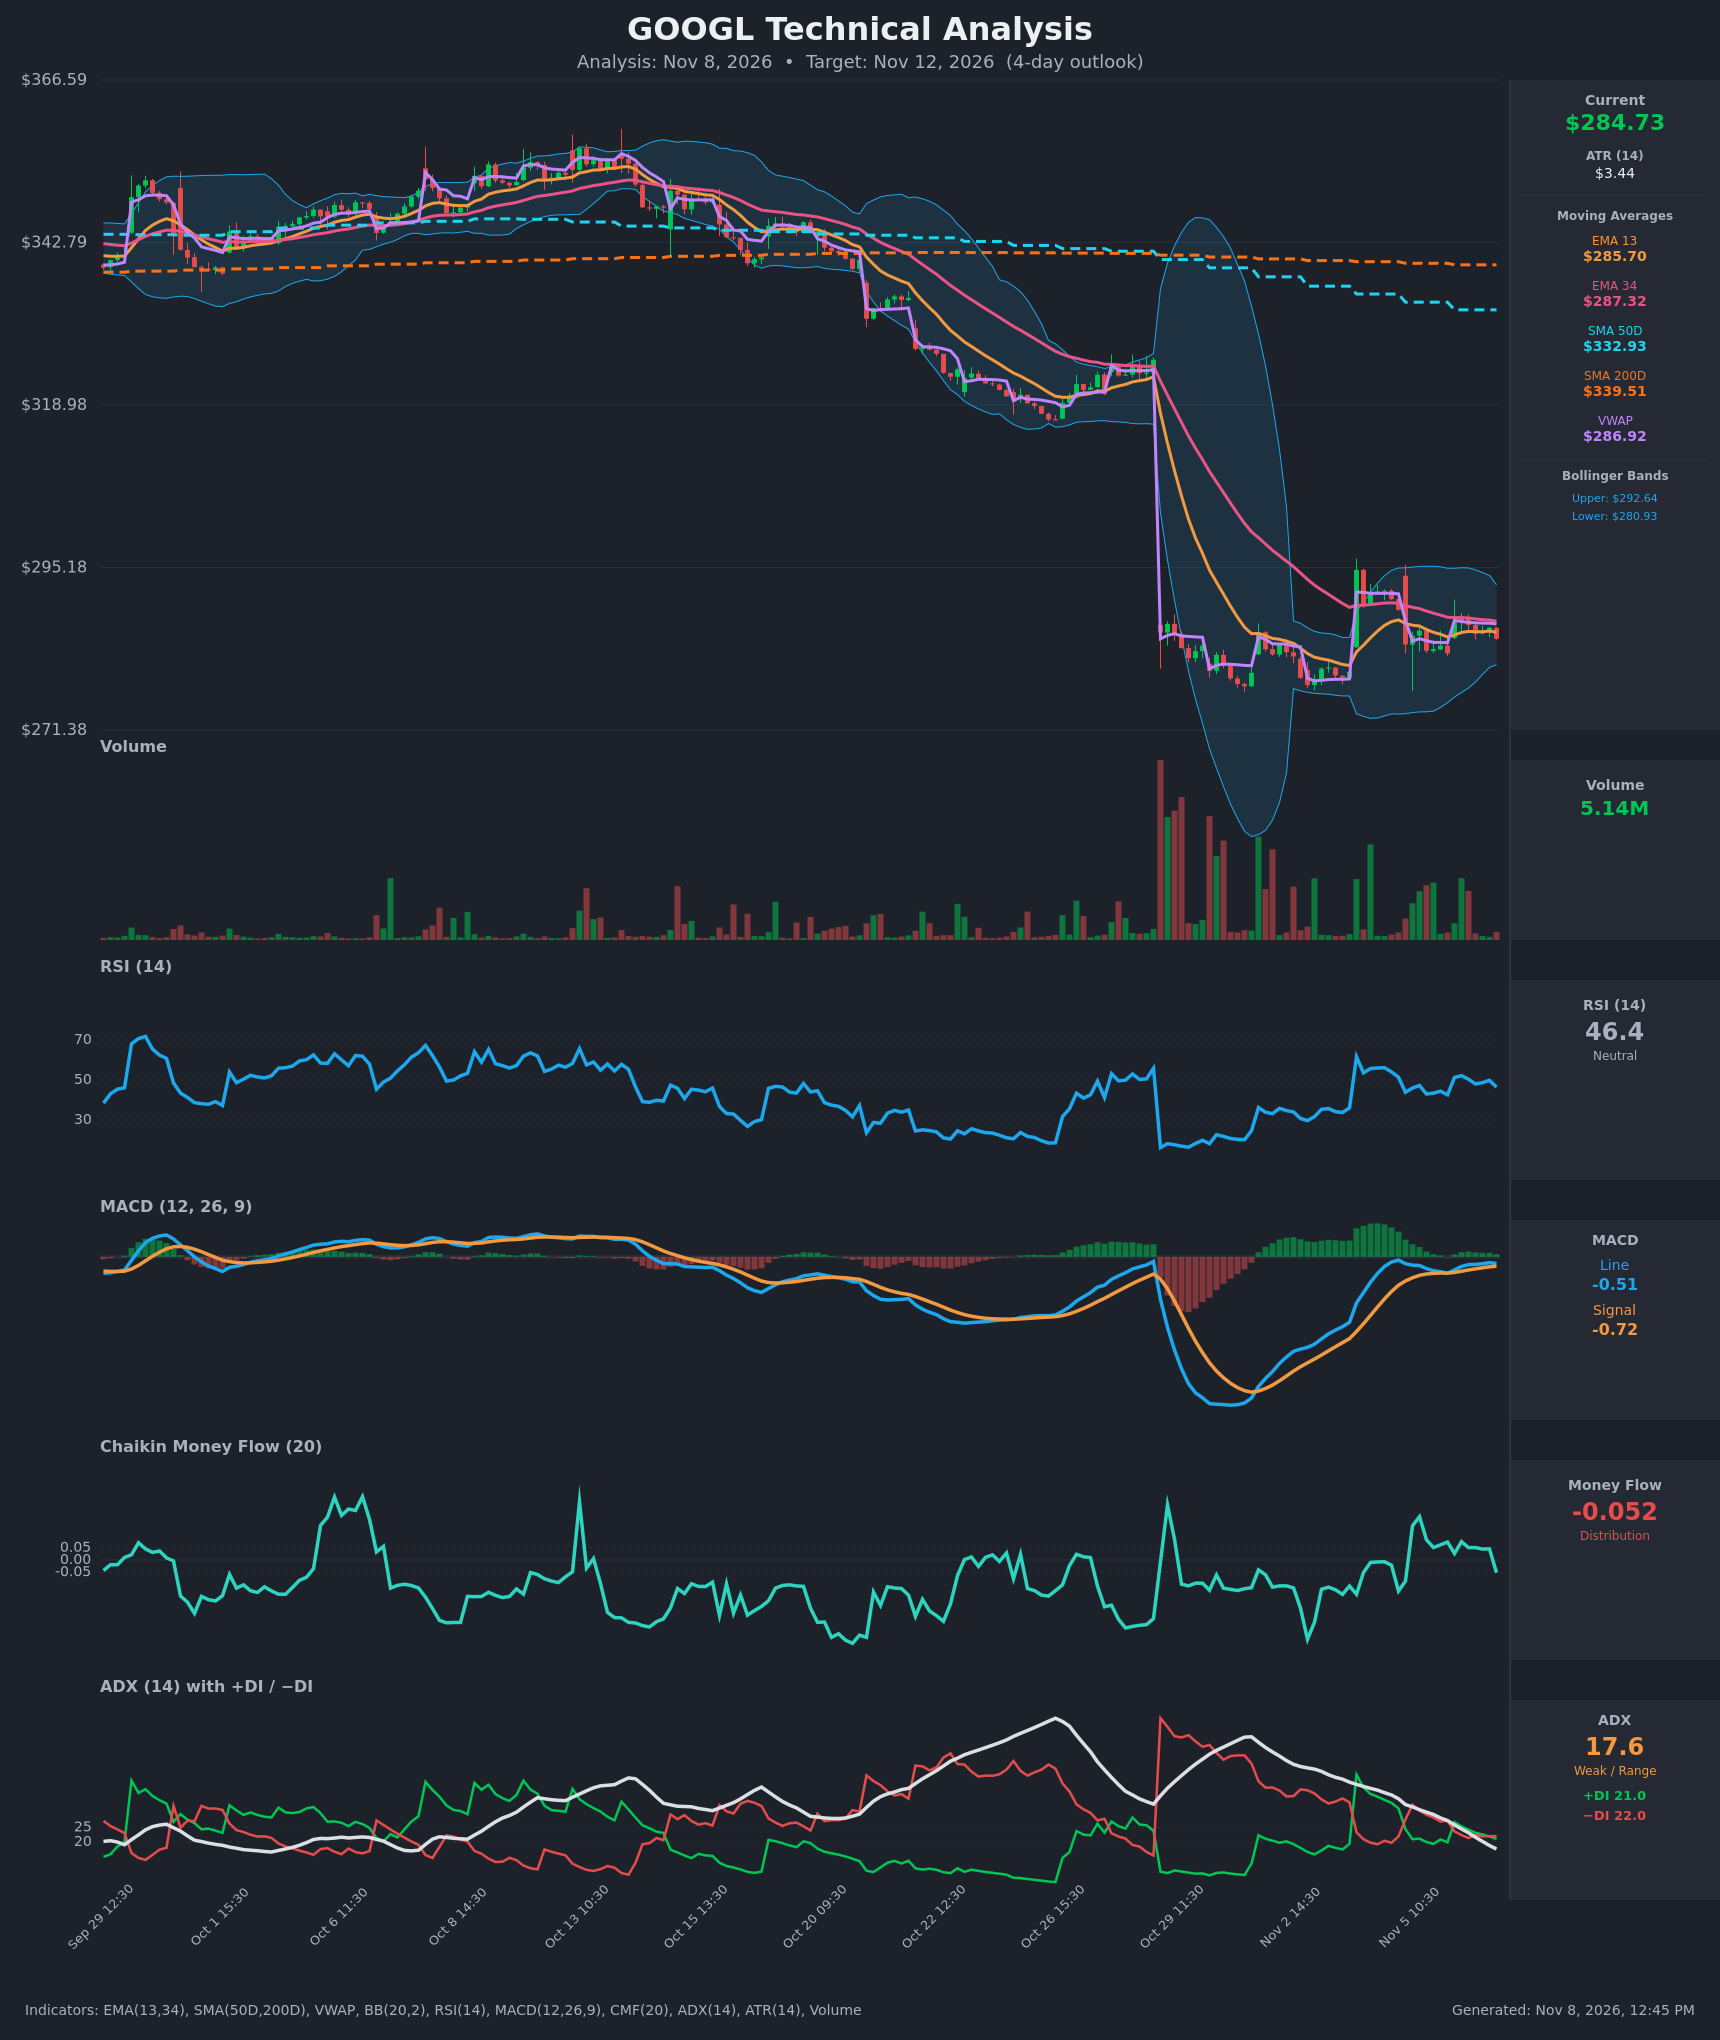
- RSI (14): 46.43, just below the 50 midline and well away from the 30/70 extremes. It has faded from about 52 on Nov 6 morning, so momentum is neutral with a slight downward tilt. [Neutral]
- 20 EMA (EMA 13/34 used): EMA 13 is $285.70 and EMA 34 is $287.32. Price at $284.73 is below both, and EMA13 is below EMA34, so the short-term structure is bearish. Both act as overhead resistance. [Bearish]
- MACD: Line -0.513 is above Signal -0.723, a small bullish crossover that happened in the last few sessions. Both lines are still below zero. The histogram is slightly positive but shrinking on the chart, and the line ticked down on the last bar. This is a weak recovery rather than a confirmed turn. [Neutral]
- Bollinger Bands (20): Upper $292.64, lower $280.93, so price sits in the lower-middle of the band (middle is about $286.8). The bands have narrowed sharply from the Oct 29 gap-down expansion, which signals a volatility squeeze and a consolidation. [Neutral]
- CMF (20): -0.052, just under the -0.05 threshold. It dropped from a slightly positive reading of about +0.05 on the final bar, which shows marginal distribution and fading buying pressure. [Distribution]
- ADX (14): 17.6 and falling (it was 34.9 on Nov 4), so the trend is weak or range-bound. -DI at 22.0 is only marginally above +DI at 21.0, so the DIs are converging with no decisive control. [Weak Trend, slight bearish tilt]
- Volume: 5.14M on the latest bar, quiet compared with the huge spikes on the Oct 29 gap-down and the Nov 4-5 swings. Participation is drying up inside the consolidation, so a breakout needs a volume expansion to be credible. [Neutral / Low conviction]
DIVERGENCES & TRENDS
- Long-term trend: Price ($284.73) is far below SMA50D ($332.93) and SMA200D ($339.51). SMA50D is below SMA200D, so the death cross is already in place and the long-term trend is firmly bearish.
- Moving averages: EMA13 is below EMA34 (285.70 vs 287.32) and price is below VWAP ($286.92). Price closed below the EMA13 on the last bar after several closes hovering around it.
- MACD: It crossed above Signal around Nov 5-6, but this is a low-level crossover inside a range. The line has turned slightly lower on the last bar.
- ADX: It has dropped from above 34 to 17.6 as the post-gap-down selloff stalled. The DI lines have converged and nearly crossed.
- Divergence: There is no clear price/RSI divergence. Price has been flat to slightly lower while RSI and MACD recovered from their lows. That is mild bullish momentum relief, but price has not confirmed it.
- CMF: It was positive for several bars around Nov 4-6, then slipped back below -0.05. That is a failed accumulation attempt and a minor bearish signal.
CHART PATTERNS
- Primary read: Bearish Pennant / Flag-type consolidation after a sharp drop (continuation). The Oct 29 gap-down from about $320 to the mid-$280s was followed by a tight sideways range of roughly $280-$292 with narrowing Bollinger Bands. This resembles the Bearish Pennant/Flag in the reference. A breakdown below about $280-281 would project a measured move far lower, but for a 4-day horizon the practical target is the next support area in the high $270s.
- Alternative: Bullish Double Bottom / Triple Bottom base. The lows near $280 have been tested several times. A break above $292 (upper band) would invalidate the bearish read and open a retrace toward $300.
- ADX is weak, so a rectangle/range remains plausible until a boundary breaks.
POTENTIAL SCENARIOS
- Scenario 1: Bearish Drift and Range-Low Retest — Price stays capped under the EMA13/EMA34/VWAP cluster, distribution continues, and price retests the lower Bollinger Band area, possibly poking below it. Trigger: rejection at $286.90-$287.30, or a close below $283. Target: $280.90, then $278 if the lows break. Invalidation: a close above $288 with rising volume. (45% probability)
- Scenario 2: Neutral Range Chop — The squeeze persists with weak ADX, and price oscillates between about $281 and $288 and ends near the current level. Trigger: failure to close outside the $281-$288 area. Target: $283-$287. Invalidation: a decisive close above $292.64 or below $280. (30% probability)
- Scenario 3: Bullish MACD-Led Relief Rally — The MACD crossover follows through, price reclaims the EMA13/34 and VWAP, and it squeezes toward the upper band. Trigger: a close above $287.32 on rising volume. Target: $292.60, with an extension to about $295. Invalidation: a close back below $283. (25% probability)
PRICE TARGETS
For a 4-day timeframe, the range width is about 4.2% of the current price (about $12 / $284.73), which fits the roughly 3-5% guide for this horizon.
- Target Price: $282.00 (4 days out)
- Expected Range: $277.00 to $289.00
- Key Levels: Support at $280.93 (lower Bollinger Band), Resistance at $287.32 (EMA 34, with VWAP at about $286.92 just below)
OVERALL BIAS
OVERALL BIAS: BEARISH - Price is below EMA13, EMA34, VWAP and both major SMAs (with a death cross in place), CMF has slipped back into mild distribution, and -DI is marginally on top. The post-gap-down consolidation looks like a bearish continuation pennant, with the weak MACD crossover and neutral RSI offering only limited counterweight.
This is educational analysis and not financial advice.