GOOGL 6-day bearish forecast — Nov 8, 2026
- Bias: Bearish
- Timeframe: 6 days (made Nov 8, 2026, target date Nov 13, 2026)
- Price at analysis: $284.73
- Price target: $282.00
- Expected range: $275.50 – $292.50
- Result: Incorrect (+3.3%) — closed at $294.00 on Nov 13, 2026; quality score 35/100
Get a free AI analysis of GOOGL today
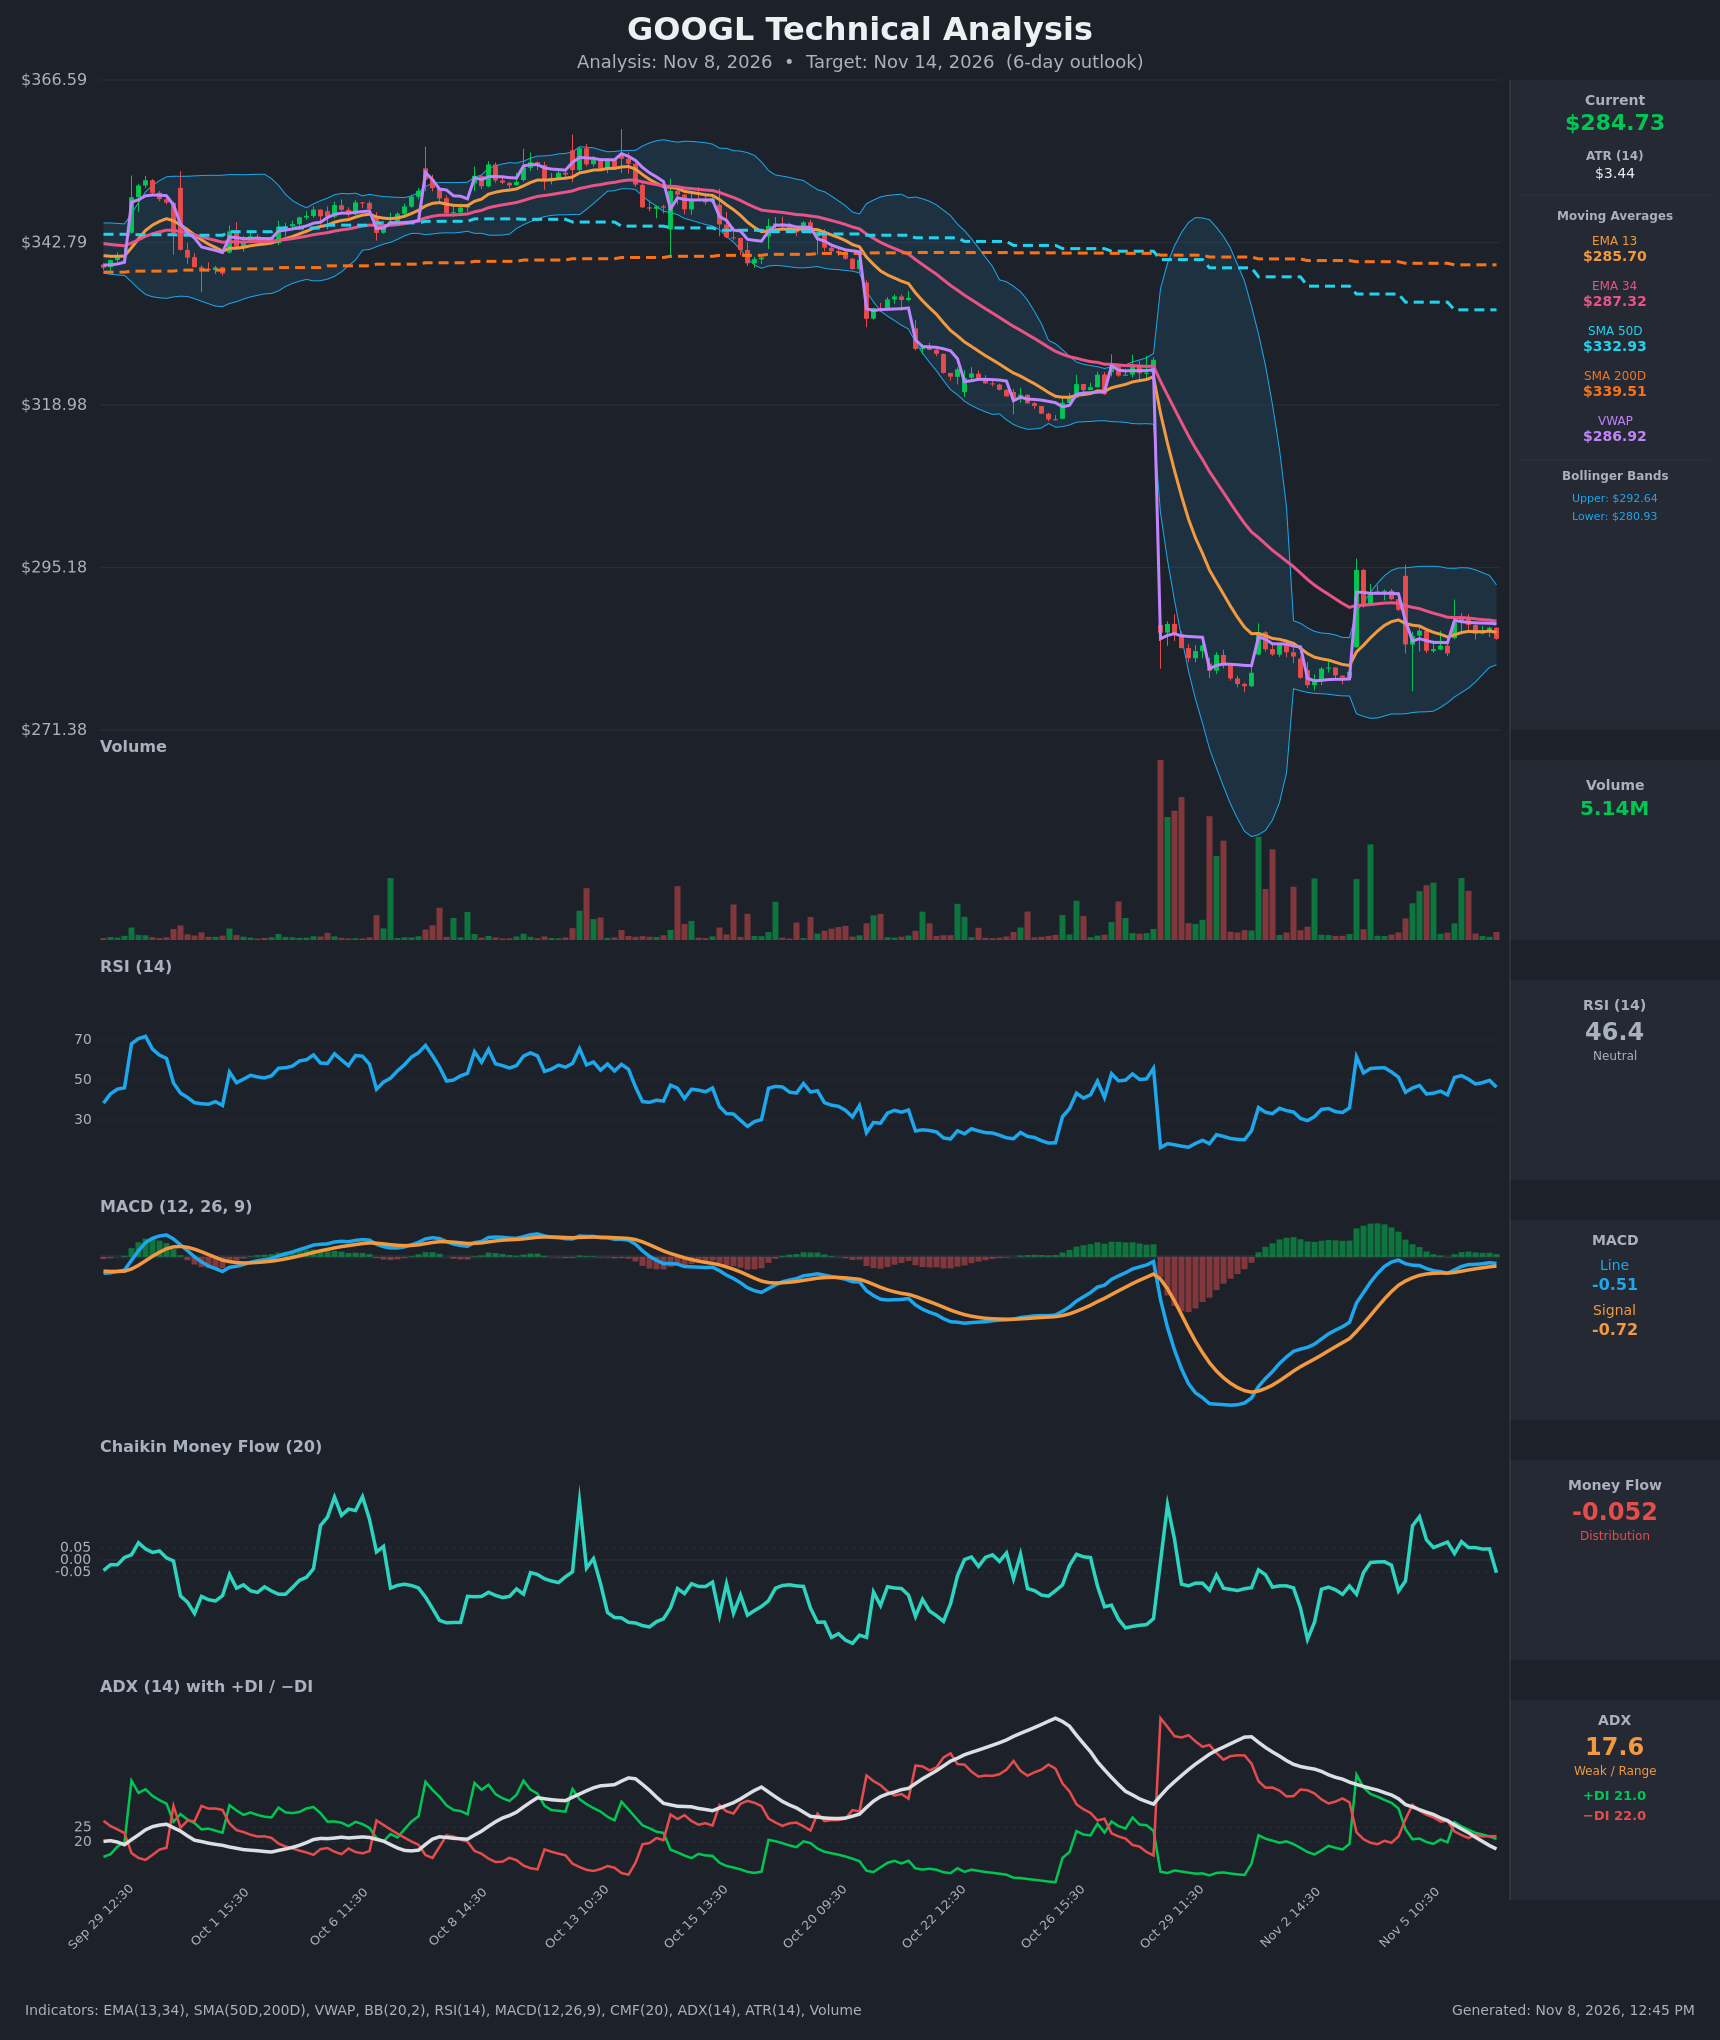
Analysis
TECHNICAL INDICATORS
- RSI (14): 46.4, just under the 50 midline and well inside neutral territory. It has rolled over from 52 (Nov 6 10:30) and is making lower highs within the range. [Neutral]
- 20 EMA: The supplied values are EMA 13 at $285.70 and EMA 34 at $287.32. Price ($284.73) is below both, so they act as resistance. EMA13 is below EMA34 (bearish alignment) and is flattening, so the pressure is mild. [Bearish]
- MACD: Line -0.51 is above signal -0.72, a small bullish crossover that occurred below the zero line. The histogram is slightly positive but shrinking from its recent peak, and the line stalled and ticked down on the last bar (-0.455 to -0.513). This is fading, not accelerating, momentum. [Neutral]
- Bollinger Bands (20): Upper $292.64, lower $280.93, with price at $284.73, in the lower half of the bands. The bands have narrowed sharply after the late-October expansion, so volatility is compressing into a range. A squeeze like this often precedes a move, but it gives no direction on its own. [Neutral]
- CMF (20): -0.052, just below the -0.05 distribution threshold after turning from slightly positive (+0.05 to +0.07) in recent bars. It is a marginal slip into distribution, but it is the direction of travel that matters. [Distribution]
- ADX (14): 17.6 and falling (from 35 on Nov 4), so the trend is weak and the market is range-bound. −DI (22.0) is barely above +DI (21.0). The DIs have converged and flipped repeatedly, so neither side is in control. [Weak Trend, slightly bearish]
- Volume: 5.14M on the latest bar, a normal, low-conviction level compared with the huge spike volume on the late-October gap-down. Volume has dried up as price consolidates. [Neutral, consolidation]
Other context:
- Price is below VWAP ($286.92), which is mildly bearish.
- Price is far below SMA50D ($332.93) and SMA200D ($339.51), and SMA50 is below SMA200 (death-cross structure). This is a clear long-term downtrend.
DIVERGENCES & TRENDS
- Trend: After the large gap-down (from about $322 to about $285), price has stabilized in a roughly $280–$292 box. It is still far under every long-term average.
- MACD vs price: MACD recovered from deep negative levels toward the zero line while price went sideways. This is momentum repair, not a bullish divergence. The histogram is now flattening.
- RSI: It has failed to hold above 50 in the last bars and is turning down from 52, so there is no bullish divergence.
- CMF: It has rolled from slightly positive to slightly negative, which weakens the bullish case.
- ADX/DI: ADX has fallen from 35 to 17.6 as the selloff exhausted itself. The DI lines are tangled with −DI marginally on top, so there is no directional edge from them.
- Crossovers:
- The small MACD bullish cross is below zero and losing steam.
- EMA13 remains below EMA34.
- Price lost both EMAs and VWAP on the last bar.
- There is no golden cross; the SMA50 is below the SMA200.
CHART PATTERNS
- The best fit from the reference diagram is a Bearish Flag/Rectangle-type continuation consolidation. The sideways box of about $281–$292 follows a sharp, high-volume drop, with volume contracting during consolidation and BBs squeezing. Resolving lower would be consistent with the prevailing downtrend.
- A symmetrical triangle is also possible, given the converging DIs and tightening bands, but the ranges look more horizontal than converging.
- Significance and targets:
- A break below about $280.9–$279 would open a move toward the low-$270s, with the measured-move extension being much deeper.
- A break above $292.6 would negate the bearish continuation and target a gap-fill area near $300+.
- Pattern strength: Both are low-conviction because ADX is below 20.
POTENTIAL SCENARIOS
- Scenario 1: Bearish Range-Low Test and Breakdown Attempt — Price is rejected at EMA34/VWAP (~$287), CMF stays in distribution, and price drifts to the lower Bollinger Band and probes below. Trigger: failure to reclaim $287.3 and a close below $281. Target: $280.00 to $276.00. Invalidation: a close above $289 with CMF turning positive. (45% probability)
- Scenario 2: Neutral Range Chop — Low ADX and a compressing BB keep price oscillating between roughly $281 and $289, closing near the current level. Trigger: no decisive close outside $281–$289. Target: $283–$287. Invalidation: a close outside the $281–$292 box. (33% probability)
- Scenario 3: Bullish Squeeze Breakout — The MACD cross above signal holds, buyers reclaim the EMAs and VWAP, and price pushes to the upper band. Trigger: a close above $289–$292.6 on rising volume. Target: $292.60 to $297.00. Invalidation: a close back below $285 / EMA13. (22% probability)
PRICE TARGETS
Timeframe: 6 days (Nov 14, 2026).
- Target Price: $282.00
- Expected Range: $275.50 to $292.50 (width $17.00, about 6.0% of current price, consistent with the 7-10 day guidance scaled down for 6 days)
- Key Levels: Support at $280.93, Resistance at $287.32
OVERALL BIAS
OVERALL BIAS: BEARISH - Price sits below all key moving averages and VWAP, with a long-term death-cross structure, CMF slipping into distribution, and −DI marginally on top. The small bullish MACD cross below zero is fading, so the likely path is a drift toward the lower Bollinger Band near $281 with a modest downside bias. Conviction is modest because ADX is weak.
This is educational analysis and not financial advice.