NFLX 6-day bearish forecast — Nov 8, 2026
- Bias: Bearish
- Timeframe: 6 days (made Nov 8, 2026, target date Nov 13, 2026)
- Price at analysis: $63.40
- Price target: $62.40
- Expected range: $60.60 – $65.00
- Result: Correct (-2.3%) — closed at $61.95 on Nov 13, 2026; quality score 100/100
Get a free AI analysis of NFLX today
Analysis
TECHNICAL INDICATORS
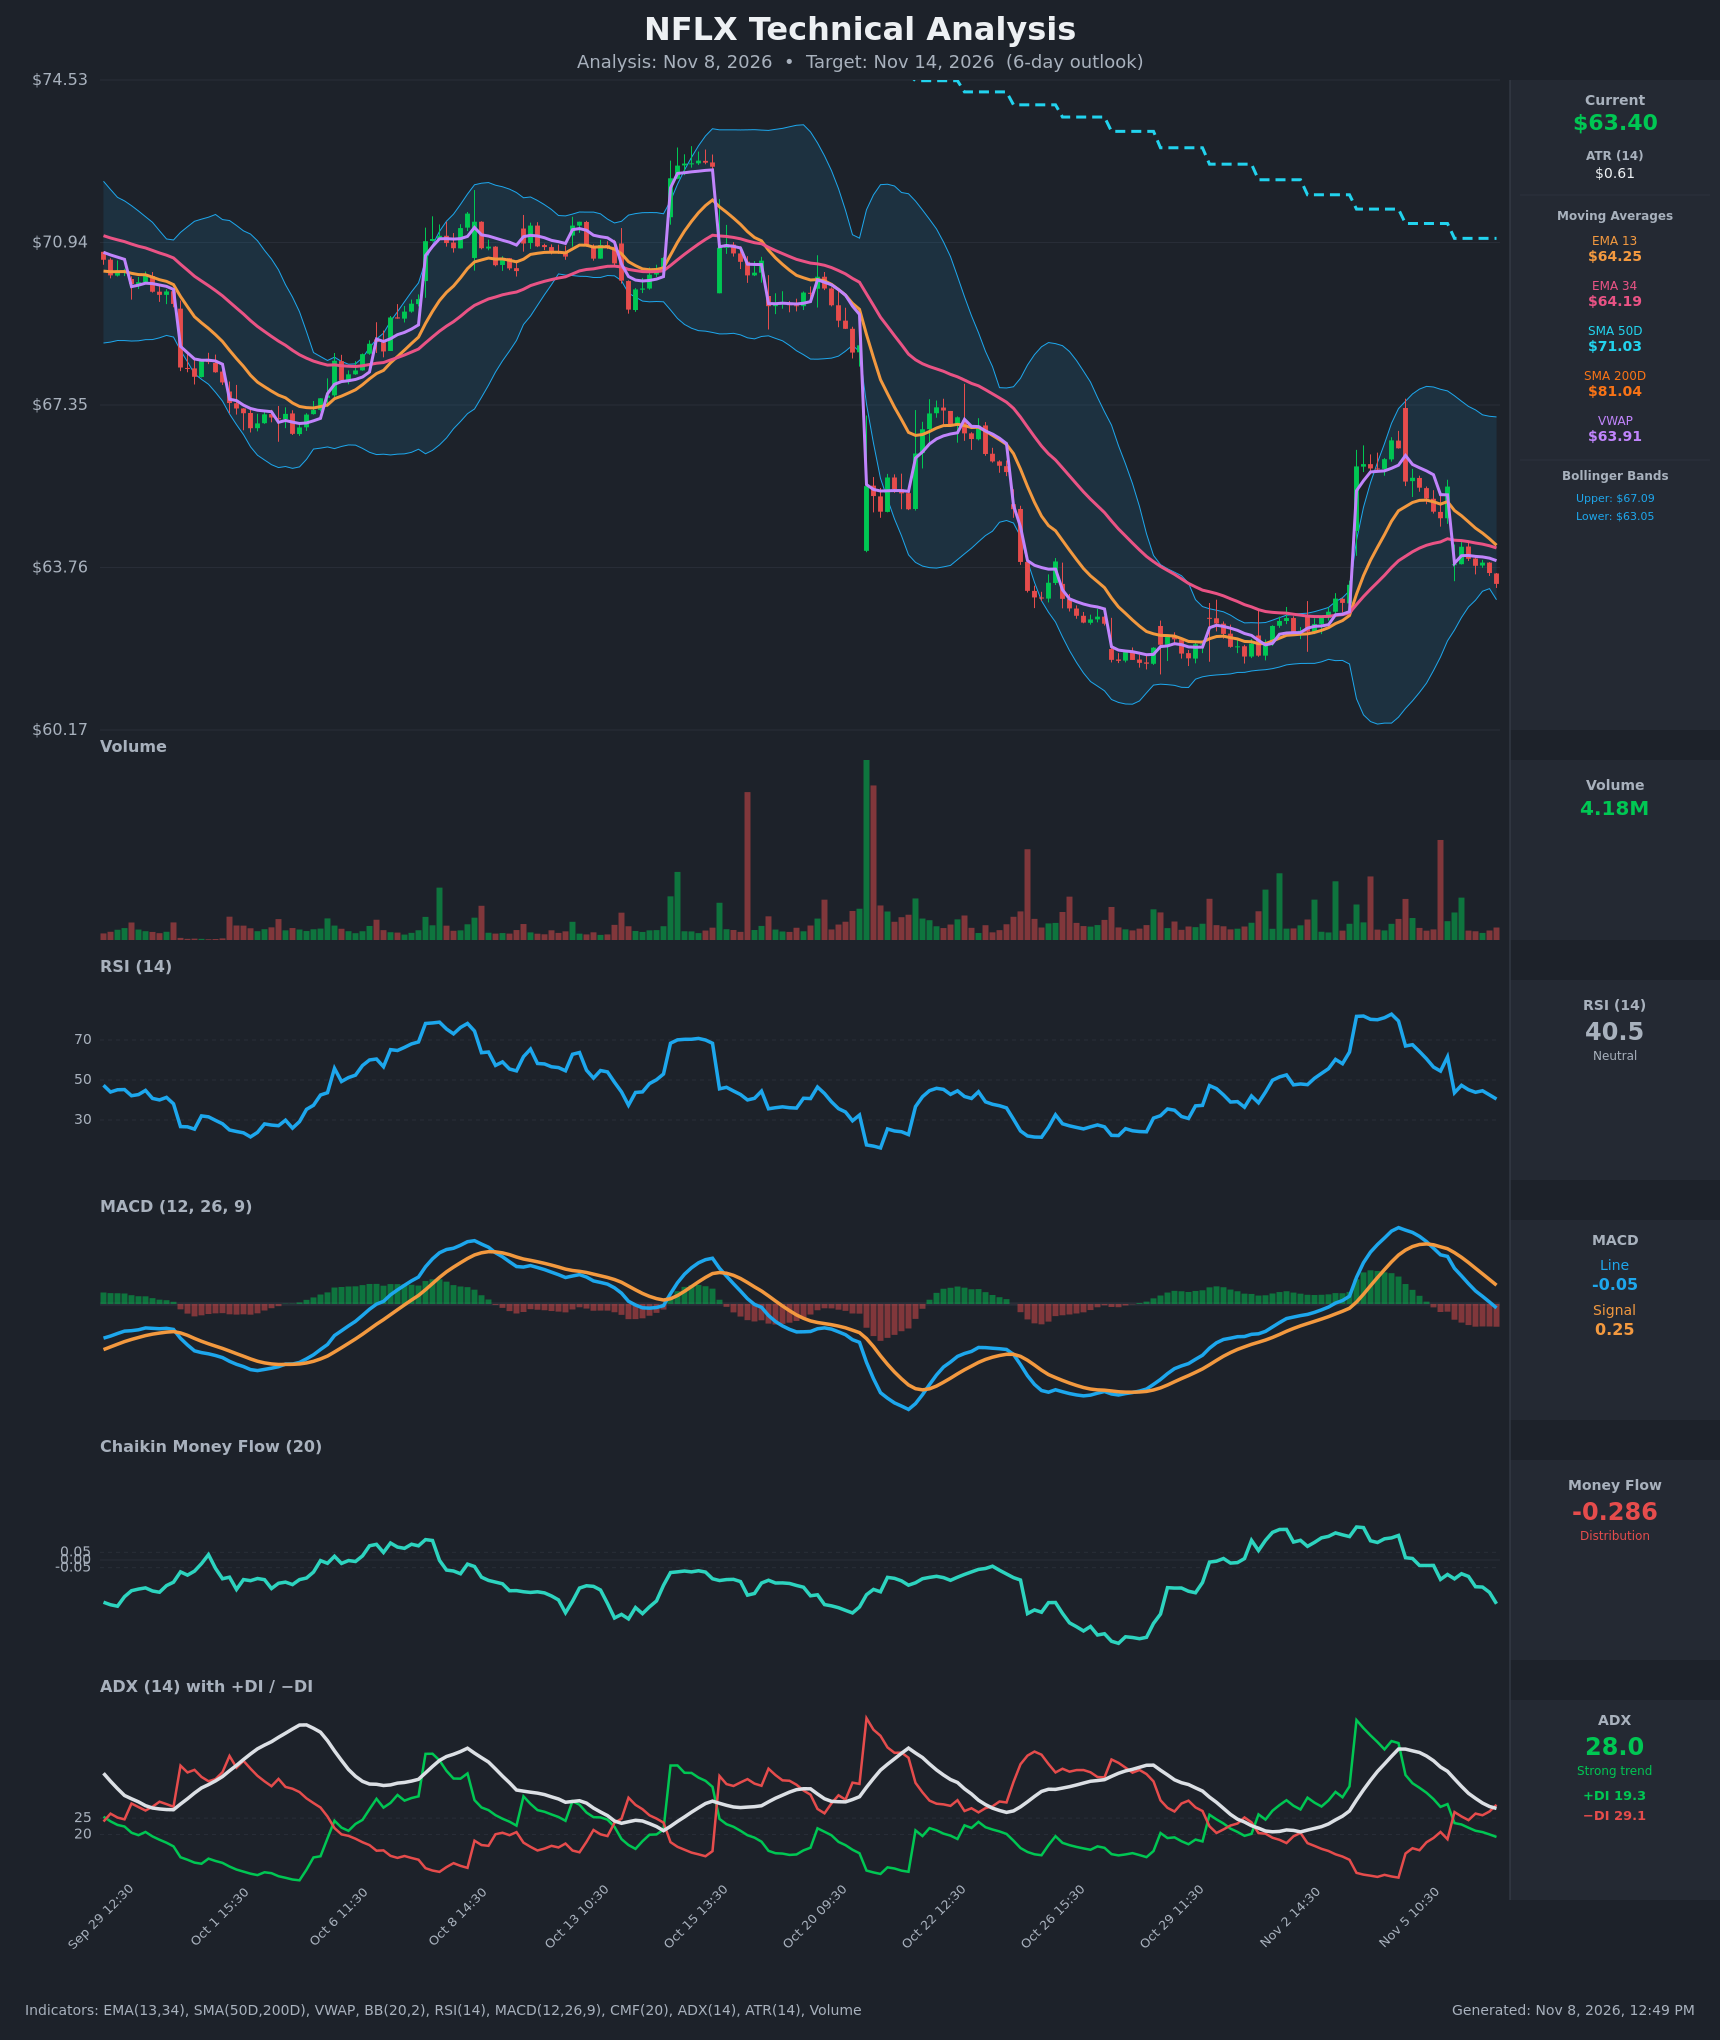
- RSI (14): 40.47, down from 79.5 on Nov 4 and 61.6 yesterday afternoon. It is sliding toward the 30 oversold line with no sign of a bottom. [Bearish]
- 20 EMA: Only the EMA 13 ($64.25) and EMA 34 ($64.19) are supplied, so they stand in here. Price at $63.40 is below both, and the EMA 13 has just crossed above the EMA 34 only marginally and is flattening. Both now act as overhead resistance around $64.2. [Bearish]
- MACD: The line (-0.053) has crossed below the signal (0.252) and gone negative. The histogram is turning increasingly negative, and the line has fallen from +1.025 in 15 bars. [Bearish]
- Bollinger Bands (20): Price at $63.40 sits just above the lower band ($63.05) and well below the midline (~$65). The bands are wide after the Nov 3-4 spike. A walk down the lower band is possible, but a bounce off it is also plausible. [Bearish]
- CMF (20): -0.286, deep in distribution and falling steadily from +0.16. Selling pressure is persistent. [Distribution]
- ADX (14): 28.0, but it is falling from 46. −DI (29.1) is above +DI (19.3) and the gap is widening. The trend is moderately strong and favors the bears. [Strong Trend – Bearish]
- Volume: 4.18M, ordinary and well below the spike days. The recent declining bars show no capitulation, so the selloff is orderly rather than panicked. Heavier volume on the Nov 3-4 rally has faded. [Neutral to Mildly Bearish]
DIVERGENCES & TRENDS
- There is no bullish divergence. RSI, MACD and CMF are all making lower lows alongside price.
- The Nov 3-4 gap-up rally has been fully retraced. The unwinding of that spike means the move was a failed breakout and the previous base area ($61-63) is now back in play.
- Price is below the SMA50D ($71.03) and SMA200D ($81.04). The 50D sits well below the 200D, a standing death-cross configuration and a long-term downtrend.
- MACD has crossed bearish. −DI has retaken control from +DI, with the crossover occurring Nov 6 morning.
- Price is below VWAP ($63.91), a sign of intraday selling pressure.
- ADX is falling from 46 even as −DI rises, so the trend is cooling in strength while it turns bearish.
CHART PATTERNS
- Bearish flag / failed breakout: The sharp spike to ~$67 followed by a steady lower-high grind resembles a bearish flag or pennant. The measured move points back toward the prior base at $61-62.
- Rejected breakout from a base: The late-Oct base at ~$61-63 produced a brief breakout that failed. A retest of the base low is the most probable path.
- No clean reversal formation (double bottom, inverted H&S) has completed, so there is no bullish pattern confirmation.
- The target is the $61.5-62 base. A break of $61 would open the $60.17 chart low.
POTENTIAL SCENARIOS
- Scenario 1: Bearish Retest of the Base — Price continues lower under the EMAs and VWAP, with MACD, CMF and −DI all confirming. Trigger: a break below the lower band at $63.05. Target: $61.80, with an extension to $61.00. Invalidation: a close above $64.30 (EMA cluster). (55% probability)
- Scenario 2: Neutral Consolidation Near the Lower Band — Price finds support near $62.5-63 and drifts sideways under the $64.2 EMA resistance while the oversold reading eases. Trigger: holding $63.0 on closing basis. Target: $63.0-64.0. Invalidation: a break below $62.5 or above $64.5. (28% probability)
- Scenario 3: Bullish Relief Bounce — A short-covering bounce from the lower band pushes price back to the EMA cluster and VWAP. Trigger: a close above $64.30 on rising volume. Target: $65.30. Invalidation: a failure back below $63.00. (17% probability)
PRICE TARGETS
- Target Price: $62.40 (6-day horizon, a decline of about 1.6% from $63.40)
- Expected Range: $60.60 to $65.00 (width $4.40, about 6.9% of the current price, in line with the 4-8% guideline for 6-10 days)
- Key Levels: Support at $62.00, Resistance at $64.25
OVERALL BIAS
OVERALL BIAS: BEARISH - Price is below all key moving averages and VWAP, MACD has crossed bearishly, −DI dominates with ADX at 28, and CMF at -0.286 shows heavy distribution. The failed Nov 3-4 breakout points to a retest of the $61.5-62 base.
This is educational analysis and not financial advice.