NFLX 4-day bearish forecast — Nov 8, 2026
- Bias: Bearish
- Timeframe: 4 days (made Nov 8, 2026, target date Nov 11, 2026)
- Price at analysis: $63.40
- Price target: $62.60
- Expected range: $61.40 – $64.40
- Result: Incorrect (+1.0%) — closed at $64.04 on Nov 11, 2026; quality score 48/100
Get a free AI analysis of NFLX today
Analysis
TECHNICAL INDICATORS
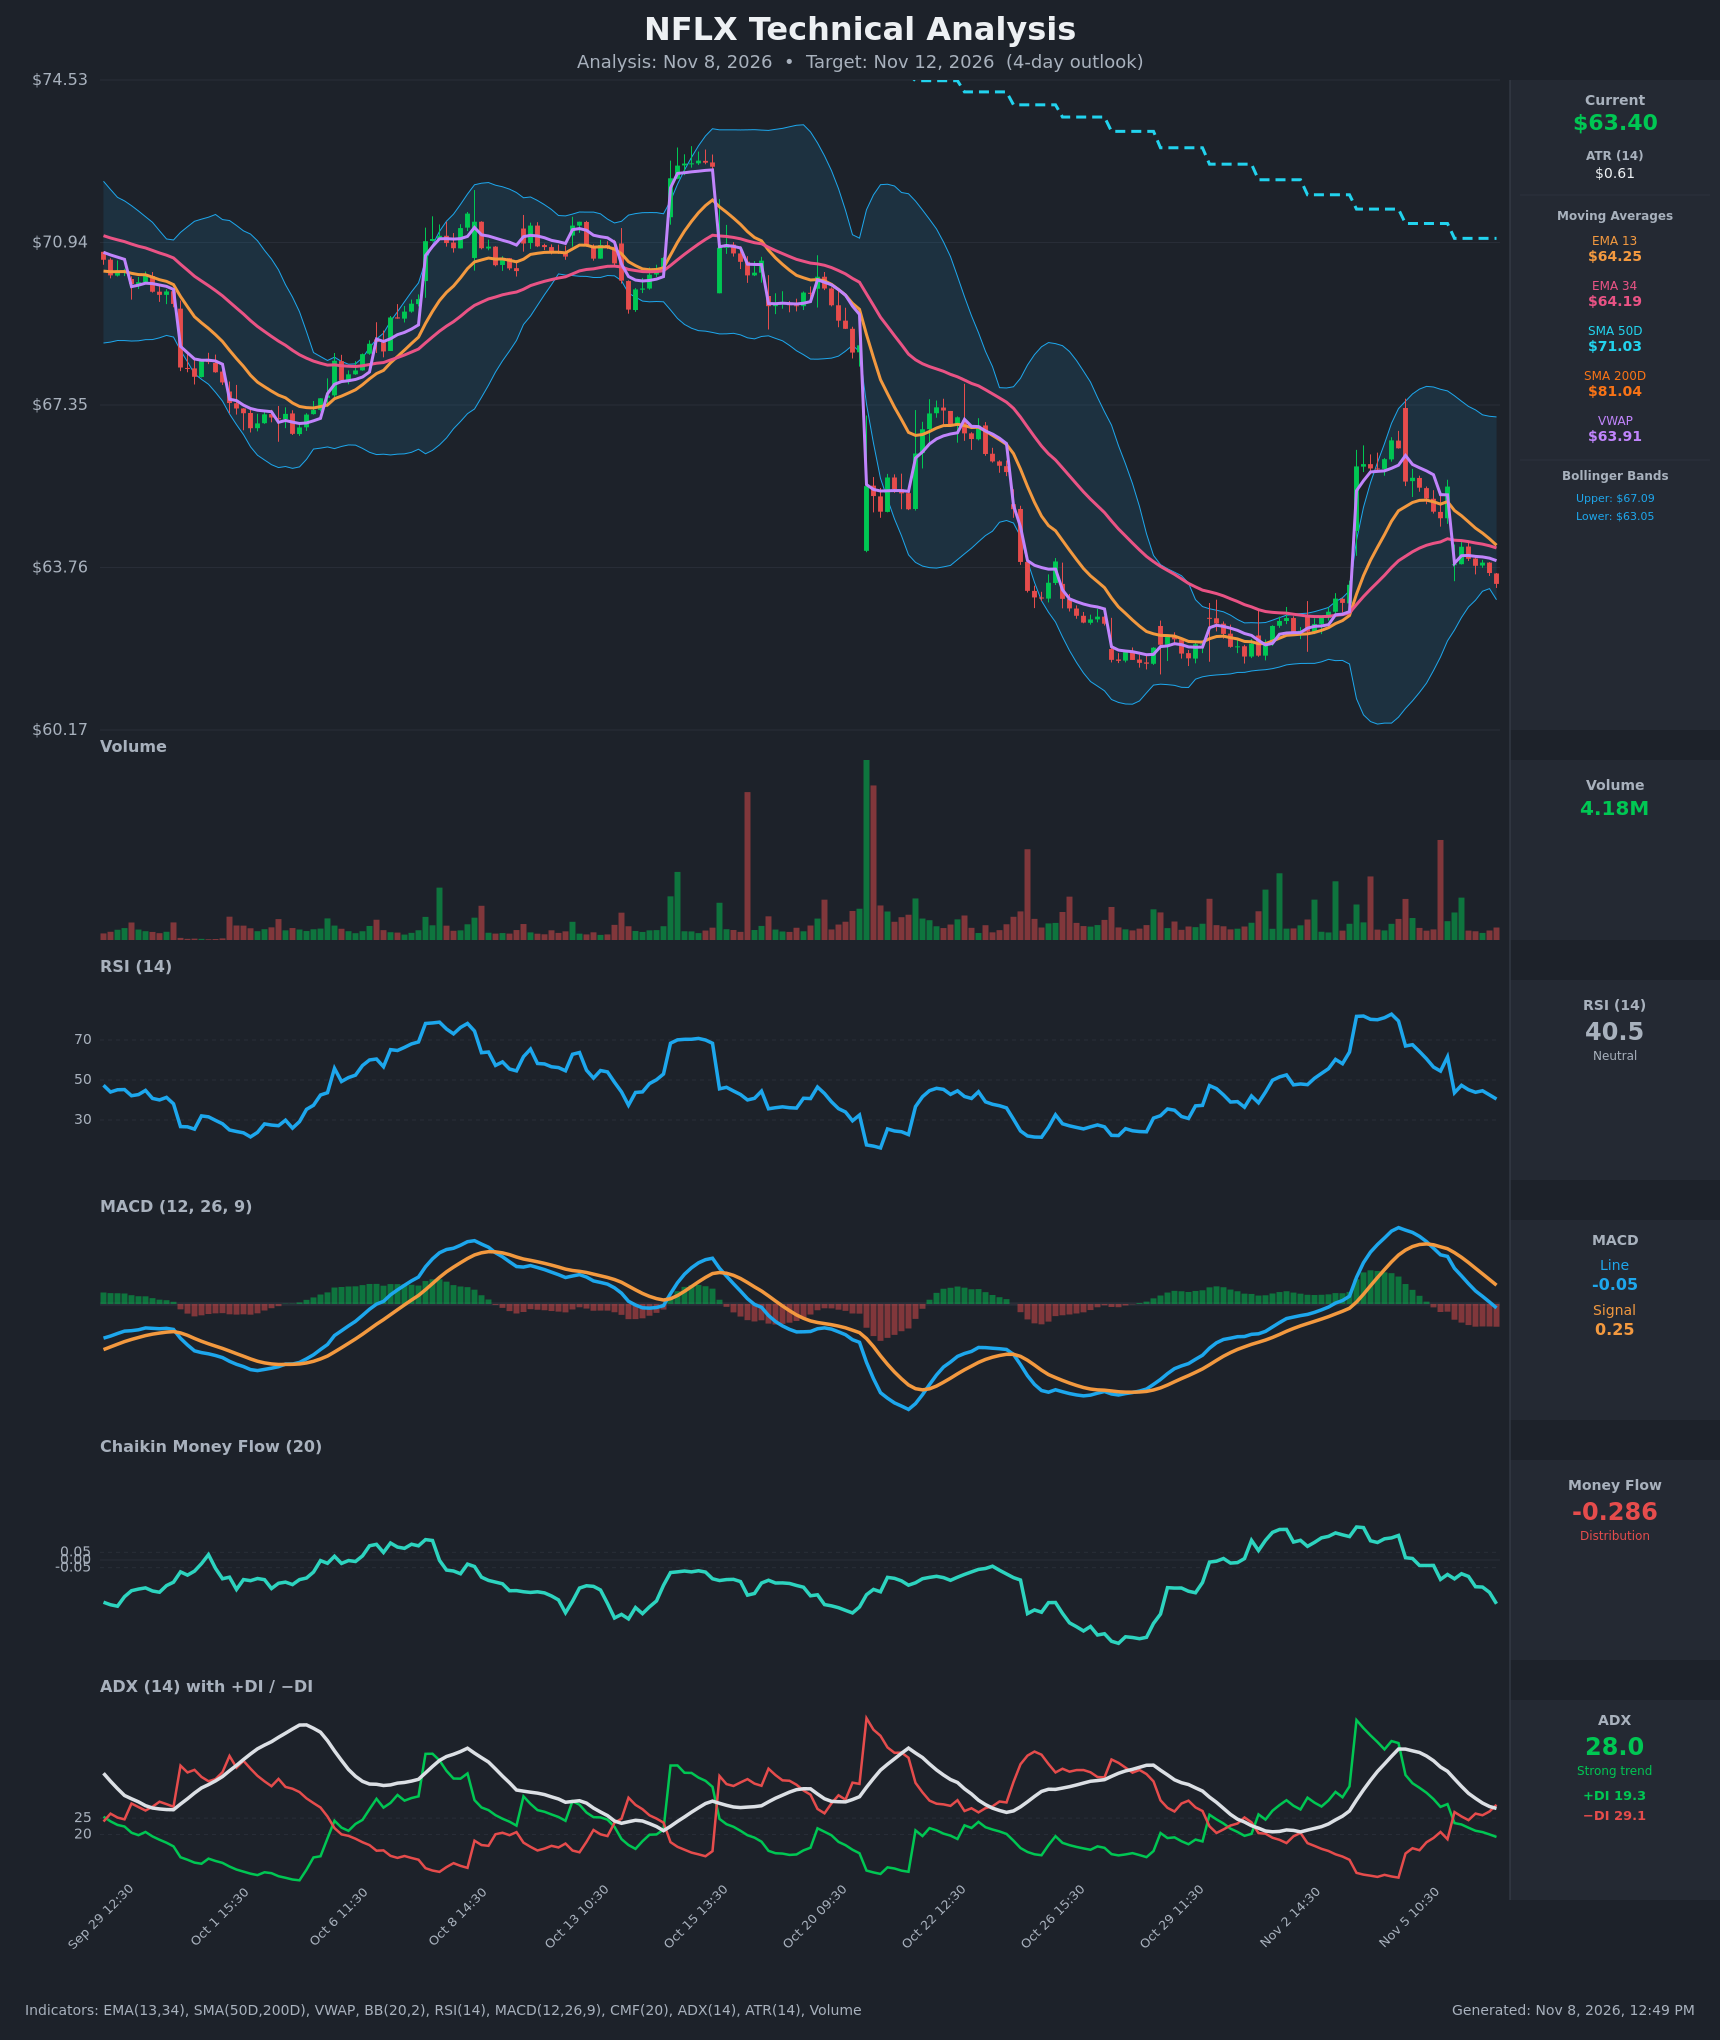
- RSI (14): 40.47, down from 67 on Nov 5 and 79.5 on Nov 4. Momentum is clearly fading, and it sits below the 50 midline but above oversold at 30. [Bearish]
- 20 EMA: The data gives EMA 13 at $64.25 and EMA 34 at $64.19. Price at $63.40 is below both, and the EMA13 is about to cross below the EMA34 (a gap of only $0.06). Both averages now act as overhead resistance. [Bearish]
- MACD: Line at -0.053, signal at 0.252, so the line has just crossed below the signal. The histogram is negative (about -0.31) and has been falling for ten straight bars. This is a fresh bearish crossover with zero-line loss. [Bearish]
- Bollinger Bands (20): Upper $67.09, lower $63.05, so price is in the bottom 9% of the band, close to the lower band. The bands are wide after the earnings-style spike, and price has walked from the upper half to the lower band. Band-walking down is bearish, though a lower-band touch raises the odds of a short-term bounce. [Bearish]
- CMF (20): -0.286, falling steadily from +0.16 and well below -0.05. This is heavy distribution and the lowest reading in the recent window. [Distribution]
- ADX (14): 28.0, with -DI (29.1) above +DI (19.3). The -DI crossed above +DI on Nov 6, though ADX itself is declining from 46, so the old uptrend is decaying while a new downtrend is just forming. [Strong Trend – Bearish direction]
- Volume: 4.18M on the latest bar. This is moderate, below the spike bars, and the recent down bars have come on average volume, so selling is steady rather than capitulative. Price is below VWAP ($63.91). [Mild bearish confirmation]
DIVERGENCES & TRENDS
- No bullish divergence has formed yet. RSI, MACD and CMF are all making lower highs and lower lows alongside price.
- The gap-up spike of Nov 4 has been almost entirely retraced. Price went from $66.39 to $63.40 over 2.5 sessions.
- The MACD bearish crossover on Nov 6 15:30 and the -DI/+DI crossover both fired in the same session. EMA13/EMA34 is on the brink of a bearish cross.
- Price is far below SMA50D ($71.03) and SMA200D ($81.04), a long-term downtrend. The SMA50 sits well below the SMA200, so the death-cross structure is already in place.
- The prior base around $61.5-$62.5 (late Oct to early Nov) is the key support zone, only about $1.0 below the current price.
CHART PATTERNS
- The broader picture is a spike-and-fade: a gap-up from the $62 base, a rounded top near $66-67, and now a decline back toward the base. This looks like a failed breakout, or a Bearish Rising Wedge/Flag-type retracement.
- Near-term, the drift lower in the last 9 bars looks like a Bearish Flag/Pennant continuation inside the larger downtrend, with a measured move toward the $62 base and possibly a retest of the $61.5 lows.
- A bullish reversal such as a Double Bottom would need price to hold $61.5-$62.5 and reclaim the EMAs near $64.2. That has not happened yet.
POTENTIAL SCENARIOS
- Scenario 1: Bearish Continuation to Base Support — Price keeps sliding below the lower Bollinger Band area with -DI dominant and MACD negative, heading for the prior consolidation zone. Trigger: break below $63.05 (lower band). Target: $62.00-$62.40. Invalidation: close back above $64.25 (EMA13/34 cluster). (55% probability)
- Scenario 2: Neutral Oversold Bounce and Chop — Price tags the lower band, finds buyers, and rebounds toward the EMA/VWAP cluster before sellers reject it. Trigger: hold of $63.05 with an RSI hook up from the low 40s. Target: $63.90-$64.25. Invalidation: break below $62.90. (30% probability)
- Scenario 3: Bullish Reversal — Dip buyers reclaim the EMAs and the gap-fill is complete, with CMF turning up. Trigger: close above $64.30 on rising volume. Target: $65.30-$66.00. Invalidation: close back below $63.40. (15% probability)
PRICE TARGETS
For a 4-day horizon (width ~3-5% of price, ATR of $0.61 implies roughly $1.2 of typical 4-day movement either way):
- Target Price: $62.60 (4-day target)
- Expected Range: $61.40 to $64.40 (width $3.00, about 4.7% of current price)
- Key Levels: Support at $62.00, Resistance at $64.25
OVERALL BIAS
OVERALL BIAS: BEARISH - A fresh MACD bearish crossover, -DI over +DI, deeply negative CMF (-0.286), and price below the EMAs and VWAP all point to continued downside toward the $62 base. A bounce from the lower Bollinger Band is the main risk, but resistance at $64.2 is likely to cap it.
This is educational analysis and not financial advice.