PLTR 4-day bearish forecast — Nov 8, 2026
- Bias: Bearish
- Timeframe: 4 days (made Nov 8, 2026, target date Nov 11, 2026)
- Price at analysis: $160.38
- Price target: $158.00
- Expected range: $152.50 – $165.00
- Result: Incorrect (+5.8%) — closed at $169.67 on Nov 11, 2026; quality score 0/100
Get a free AI analysis of PLTR today
Analysis
TECHNICAL INDICATORS
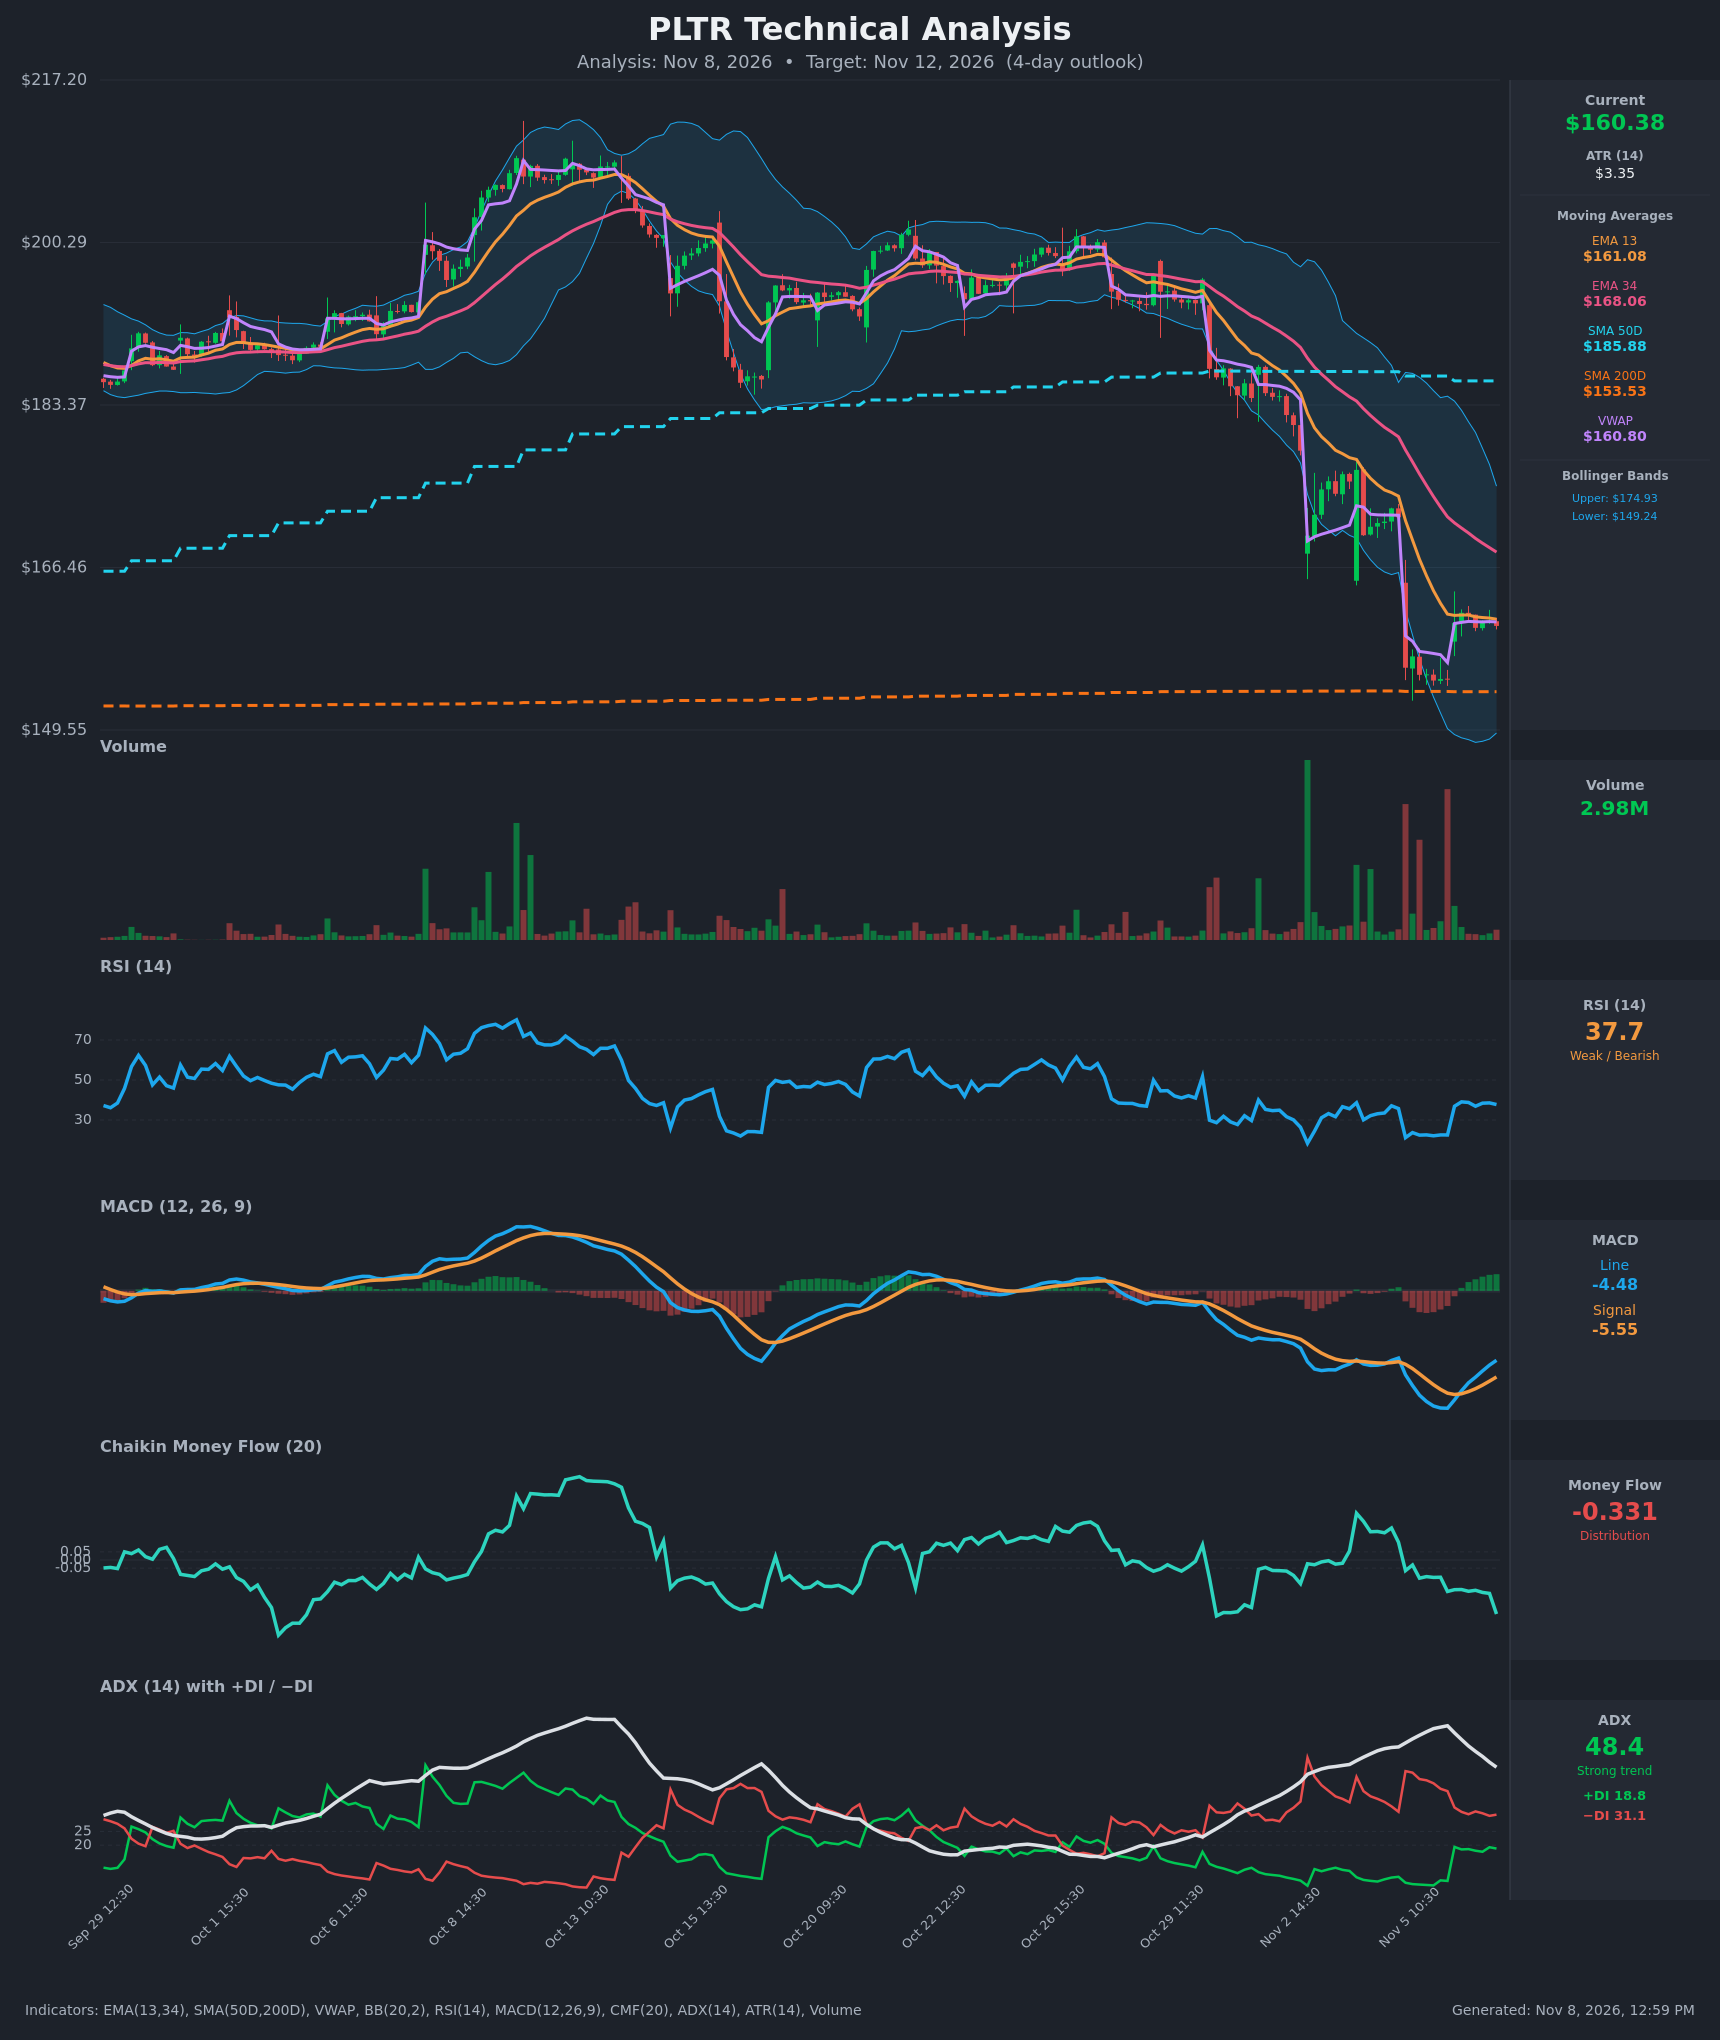
- RSI (14): 37.73. It bounced from deeply oversold (~21-22) on Nov 5 to the high 30s, but it is stalling below 40 and remains under 50. Momentum has recovered only partially. [Bearish]
- 20 EMA: The data supplies EMA 13 ($161.08) and EMA 34 ($168.06), so I use those. Price at $160.38 is just below the EMA 13, which has flattened and acts as near-term resistance. It sits well below the EMA 34, which is falling and is a larger overhead barrier. [Bearish]
- MACD: The line is at -4.48 against a signal of -5.55, so the histogram is positive (+1.08) and rising. The bullish crossover came on Nov 6 10:30. Both lines are still deeply negative, so this reads as a relief bounce inside a downtrend, not a trend reversal. [Neutral]
- Bollinger Bands (20): Upper $174.93, lower $149.24, midline about $162. Price sits in the lower-middle of the bands after tagging the lower band on Nov 5. The bands are still wide and the midline is declining, which fits a post-selloff consolidation. [Neutral]
- CMF (20): -0.331, well below -0.05, and it has fallen from -0.18 to -0.33 in the last bar. The bounce is happening without buying support. [Distribution]
- ADX (14): 48.4, a very strong trend, but it is falling from a 63.6 peak, so the downtrend is maturing and losing intensity. −DI (31.1) is above +DI (18.8), so bears still control. [Strong Trend – Bearish]
- Volume: 2.98M, light compared with the heavy-volume breakdown candles on Nov 3-5. The bounce is on low volume, which suggests weak conviction on both sides. [Neutral to Bearish]
DIVERGENCES & TRENDS
- MACD is turning up from deep negative territory while price is only consolidating. This is an early momentum-improvement signal but not a true divergence.
- RSI made a higher low (~22 on Nov 5 versus the prior low of ~25) in terms of shape, but its latest rebound has stalled below 40. That is typical of bear-market relief rallies.
- CMF is worsening (-0.19 to -0.33) while price holds flat. This is a bearish divergence: selling pressure is increasing into the bounce.
- ADX is rolling over from its peak and the −DI spike has faded. Selling is decelerating, which favors consolidation over another waterfall.
- Price is pinned at VWAP ($160.80) and the EMA 13 ($161.08).
- EMA 13 crossed below EMA 34 earlier, and that cross remains bearish. SMA 50D ($185.88) is far above price, so the death-cross structure is not in play yet. SMA 200D ($153.53) is the key support about 4% below.
- Price is above the SMA 200D (long-term uptrend intact) but below every shorter average.
CHART PATTERNS
- The sharp drop from ~$200 to ~$155 followed by a small sideways drift at $155-$162 resembles a Bearish Flag/Pennant (continuation) after the big impulse down. The flag is tight and shallow, with the lower boundary near $154-155.
- A potential Bullish Double Bottom is forming near $154.70-$155.30 (Nov 5 lows) if price retests that area and holds. This is not yet confirmed.
- Measured-move risk: a bearish flag breakdown would aim toward the SMA 200D near $153.5 and then lower, toward about $148.
- The upside is capped by the EMA 34 near $168 and the declining Bollinger midline near $162.
POTENTIAL SCENARIOS
- Scenario 1: Bearish Flag Breakdown — Price fails at the EMA 13/VWAP cluster (~$161-162), and distribution (CMF -0.33) pushes it back toward the Nov 5 lows and the SMA 200D. Trigger: close below $158.50 and then below $154.70. Target: $153.50-$155. Invalidation: close above $164.50. (45% probability)
- Scenario 2: Neutral Consolidation Near Support — Price chops between the SMA 200D area and the EMA 13/VWAP while MACD and RSI cool off. Trigger: holds $156-$163. Target: $158-$162. Invalidation: a close outside $154.50-$165. (30% probability)
- Scenario 3: Bullish Relief Rally — The MACD crossover and RSI recovery extend, and price reclaims the EMA 13 and the Bollinger midline. Trigger: close above $162.50 on rising volume. Target: $167-$168 (EMA 34). Invalidation: drop below $157. (25% probability)
PRICE TARGETS
- Target Price: $158.00 (4-day horizon)
- Expected Range: $152.50 to $165.00 (width $12.50 ≈ 7.8% of price, consistent with a 7-10 day style range scaled for 4 days, slightly wide because ATR is $3.35)
- Key Levels: Support at $153.53 (SMA 200D, near the Nov 5 lows of ~$154.70), Resistance at $168.06 (EMA 34), with nearer resistance at $161.08-$162 (EMA 13/VWAP/BB midline)
OVERALL BIAS
OVERALL BIAS: BEARISH - Price remains below the EMA 13 and EMA 34, −DI dominates, CMF shows heavy distribution, and the low-volume bounce is stalling under RSI 40. The improving MACD keeps conviction modest, and the SMA 200D at about $153.5 should provide a floor.
This is educational analysis and not financial advice.