PLTR 6-day bearish forecast — Nov 8, 2026
- Bias: Bearish
- Timeframe: 6 days (made Nov 8, 2026, target date Nov 13, 2026)
- Price at analysis: $160.38
- Price target: $157.50
- Expected range: $153.00 – $164.00
- Result: Incorrect (+3.3%) — closed at $165.70 on Nov 13, 2026; quality score 24/100
Get a free AI analysis of PLTR today
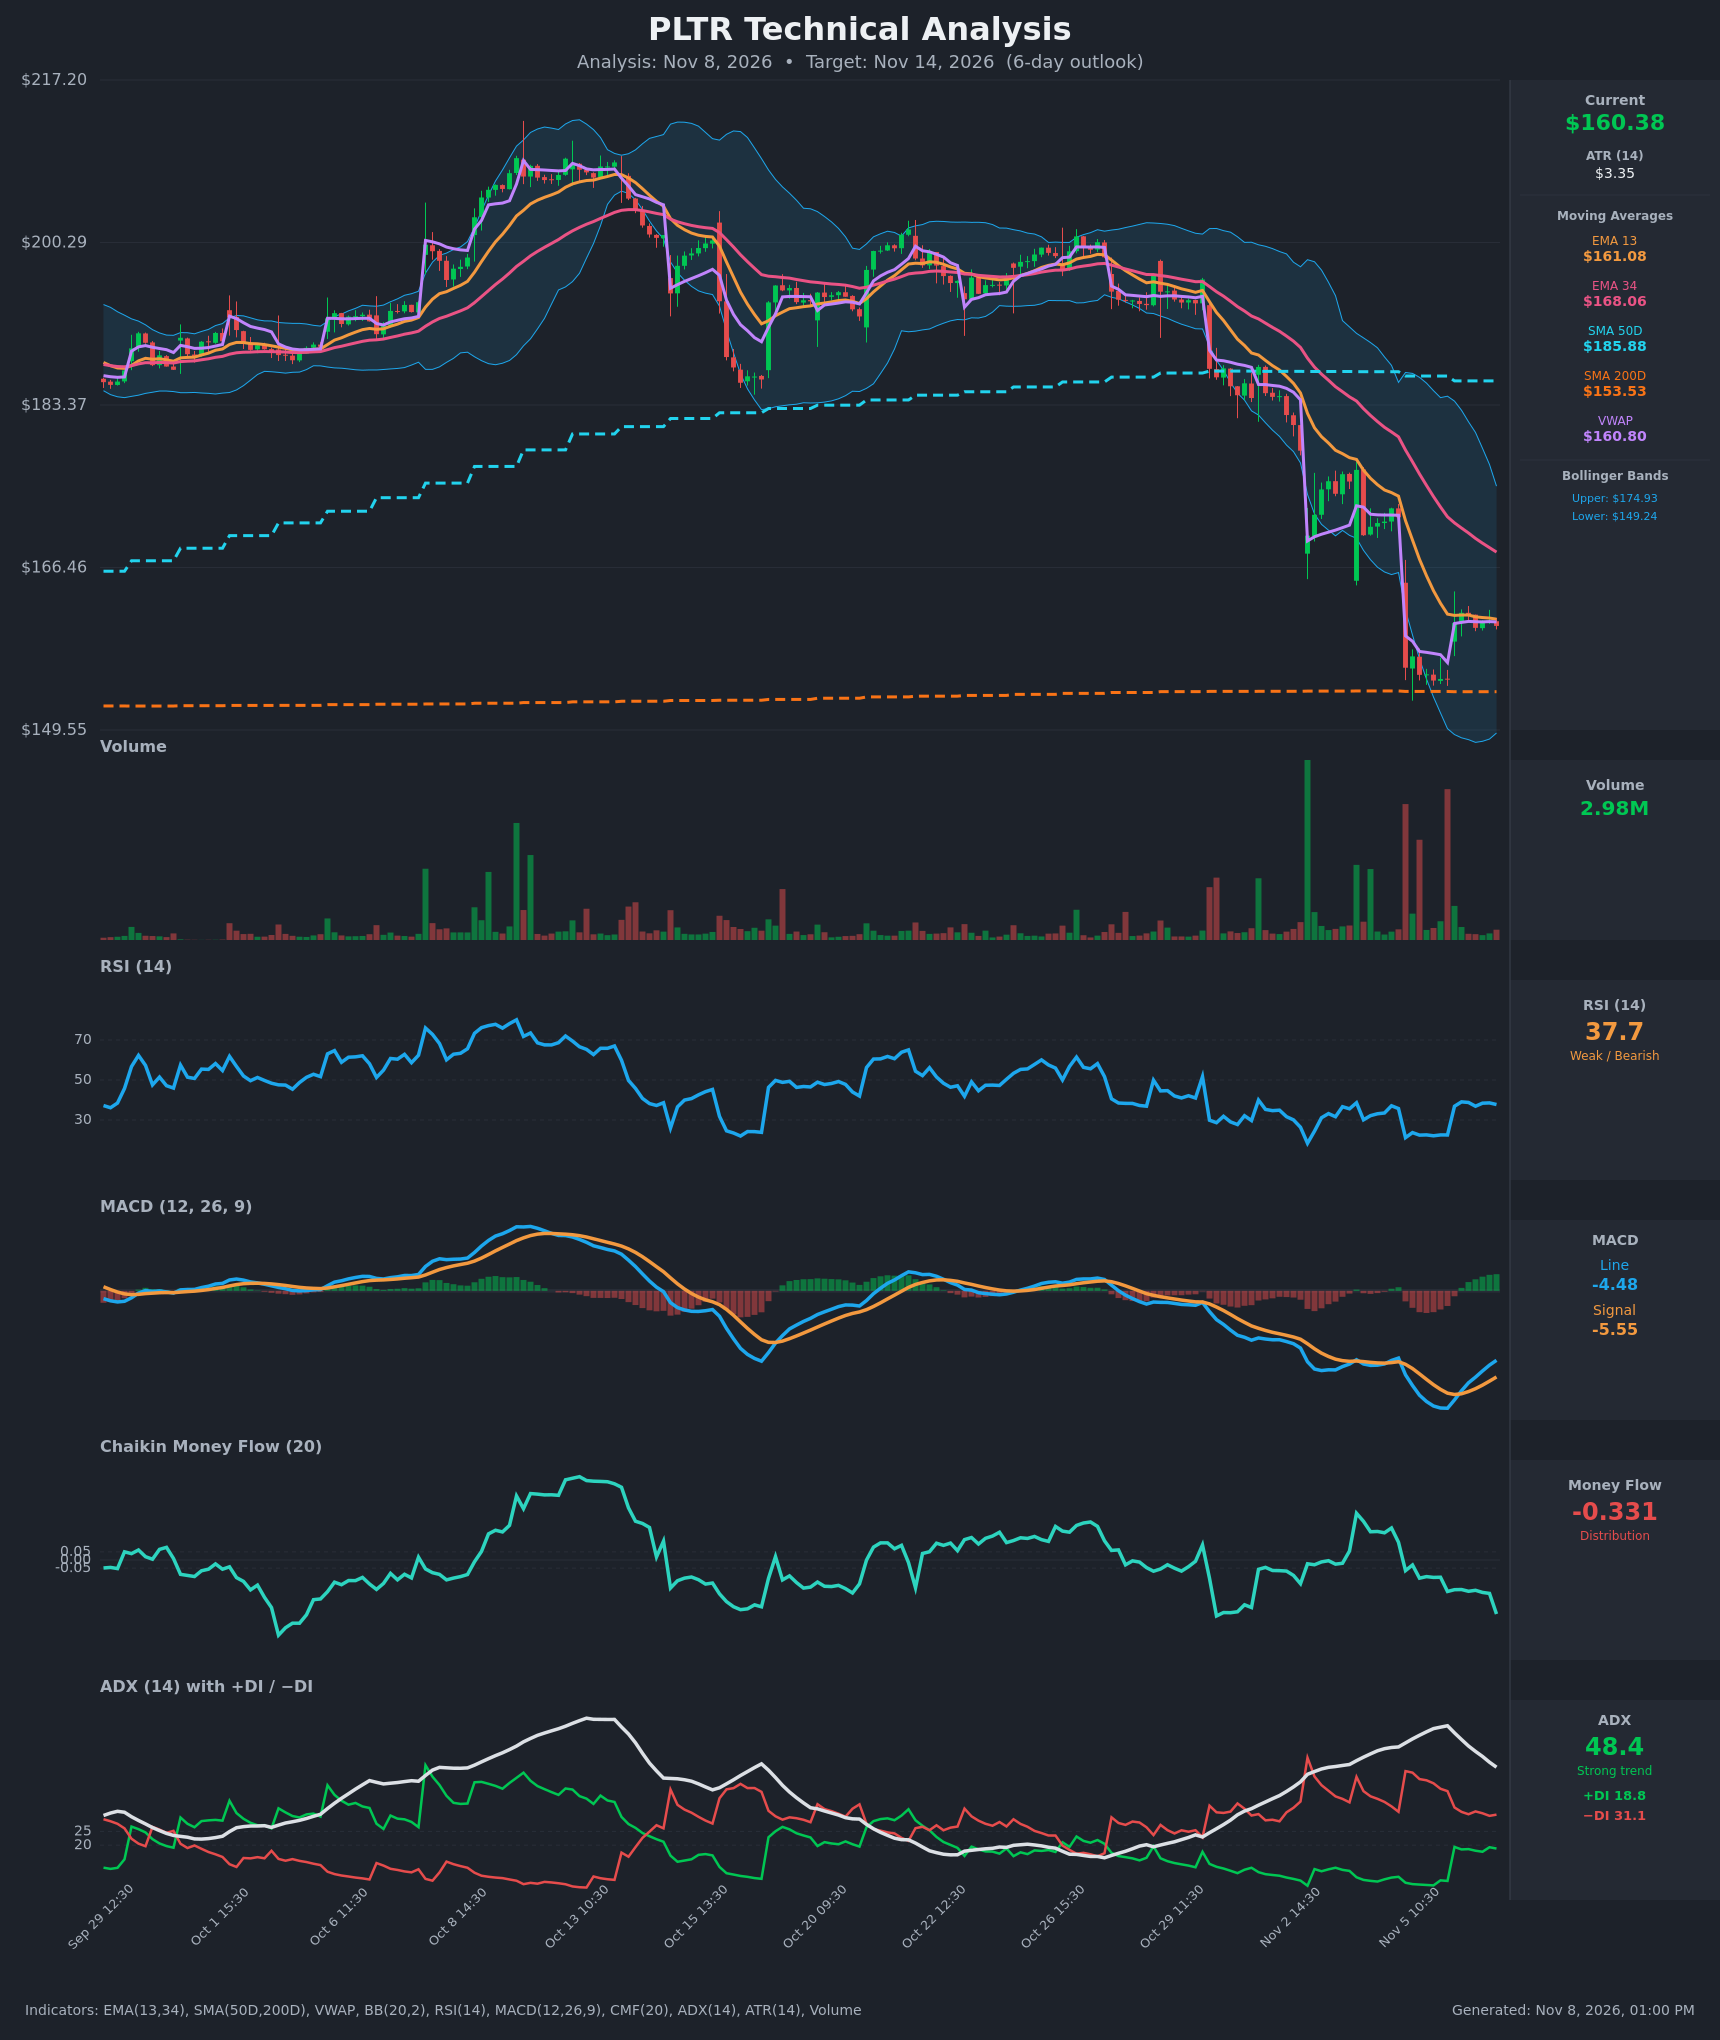
Analysis
TECHNICAL INDICATORS
- RSI (14): 37.73, recovering from a deeply oversold 21-23 on Nov 5 but stalled in the high 30s. It is still below 50 and has not regained the neutral zone, so the bounce is a relief move rather than a trend change. [Bearish]
- 20 EMA (13/34 EMAs shown): EMA 13 is $161.08 and price ($160.38) sits just below it. EMA 34 is $168.06 and still sloping down, with EMA 13 well below EMA 34 (a bearish cross that is already in place). Both act as overhead resistance. [Bearish]
- MACD: Line -4.48 is above Signal -5.55, so the histogram is positive and rising. This is a fresh bullish crossover, but it comes from deeply negative territory below zero and mostly reflects a stabilizing price after the selloff. [Bullish]
- Bollinger Bands (20): Bands run $149.24 to $174.93, with price in the lower half and the midline near $162. The Nov 5 flush pierced the lower band and price has since recovered. The bands are still wide and the midline is declining, which keeps the bias on the downside. [Neutral]
- CMF (20): -0.331 and dropping sharply on the last bar. Heavy distribution persists even while price stabilizes, so the bounce lacks buying support. [Distribution]
- ADX (14): 48.4, a very strong trend but rolling over from a peak above 63. −DI (31.1) is well above +DI (18.8), so bears still control the trend. The falling ADX suggests the downtrend is maturing and may consolidate. [Strong Trend – Bearish, fading]
- Volume: 2.98M on the latest bar, light compared with the huge spikes on the Nov 4-5 breakdown. The bounce is occurring on thin volume, which makes it less convincing. [Weak bounce / lack of conviction]
DIVERGENCES & TRENDS
- Price made lower lows on Nov 5 while RSI and MACD are now recovering from their extremes. This is an early momentum improvement, but not a classic divergence, because the bounce has not yet made a higher swing high.
- CMF is diverging bearishly from the stabilizing price: price is flat around $160 while CMF falls to -0.33, which suggests sellers are using the bounce to exit.
- MACD has crossed above its signal line, but below zero. This is a weak bullish signal inside a downtrend.
- Price is above SMA200 ($153.53) but below SMA50 ($185.88). The SMA50 is rolling over toward the SMA200, so a potential death cross is approaching over the coming weeks.
- Price is hugging VWAP ($160.80), reflecting balanced intraday flow after the gap-down.
- DI lines remain bearish (−DI above +DI), though the gap has narrowed from the Nov 5 extremes.
CHART PATTERNS
- The broader structure is a breakdown from a distribution range ($195-$200) with a sharp gap-down, followed by a small sideways consolidation around $155-$162. This resembles a Bearish Flag/Pennant continuation from the reference diagram (sharp drop, then a tight base), pointing to a measured move lower if the base breaks.
- The tight base sits directly on the rising-flat SMA200 at $153.53. A breakdown through $153-$154 would target the low $140s. A move above $162-$168 (EMA 13 and EMA 34) would invalidate the flag and open a mean-reversion bounce.
- Over the 6-day window, the base is more likely to resolve with a drift lower and a retest of support than with a full reversal.
POTENTIAL SCENARIOS
- Scenario 1: Bearish Rejection and Retest of SMA200 — Price fails at EMA 13 and the $162 area, and persistent distribution (CMF -0.33) pulls it back toward the SMA200. Trigger: Failure to close above $161.75 and a drop below $158. Target: $153.50-$155. Invalidation: Daily close above $164. (45% probability)
- Scenario 2: Bullish Relief Rally — The MACD crossover and the oversold RSI bounce extend, and price reclaims EMA 13 and the Bollinger midline. Trigger: Break and hold above $162 with rising volume. Target: $166-$168 (EMA 34). Invalidation: Drop below $155. (35% probability)
- Scenario 3: Neutral Sideways Base — Price chops between SMA200 support and EMA 13/VWAP resistance as the ADX fades. Trigger: Inside-day action between $155 and $162. Target: $158-$161. Invalidation: Close outside the $153-$164 range. (20% probability)
PRICE TARGETS
- Target Price: $157.50 (6-day)
- Expected Range: $153.00 to $164.00 (width $11.00 ≈ 6.9% of current price, consistent with the 6-day guidance of ~4-8%)
- Key Levels: Support at $153.53 (SMA200), Resistance at $161.75 (recent bounce high, just above EMA 13 at $161.08)
OVERALL BIAS
OVERALL BIAS: BEARISH - The trend remains strongly down (ADX 48 with −DI dominant, price below the 13/34 EMAs and SMA50), CMF shows heavy distribution, and the bounce is occurring on light volume. The MACD crossover and the SMA200 floor limit the downside, so I expect a drift toward support rather than a collapse.
This is educational analysis and not financial advice.