MSFT 6-day bearish forecast — Nov 8, 2026
- Bias: Bearish
- Timeframe: 6 days (made Nov 8, 2026, target date Nov 13, 2026)
- Price at analysis: $530.55
- Price target: $524.50
- Expected range: $513.50 – $540.00
- Result: Correct (-1.6%) — closed at $521.93 on Nov 13, 2026; quality score 100/100
Get a free AI analysis of MSFT today
Analysis
TECHNICAL INDICATORS
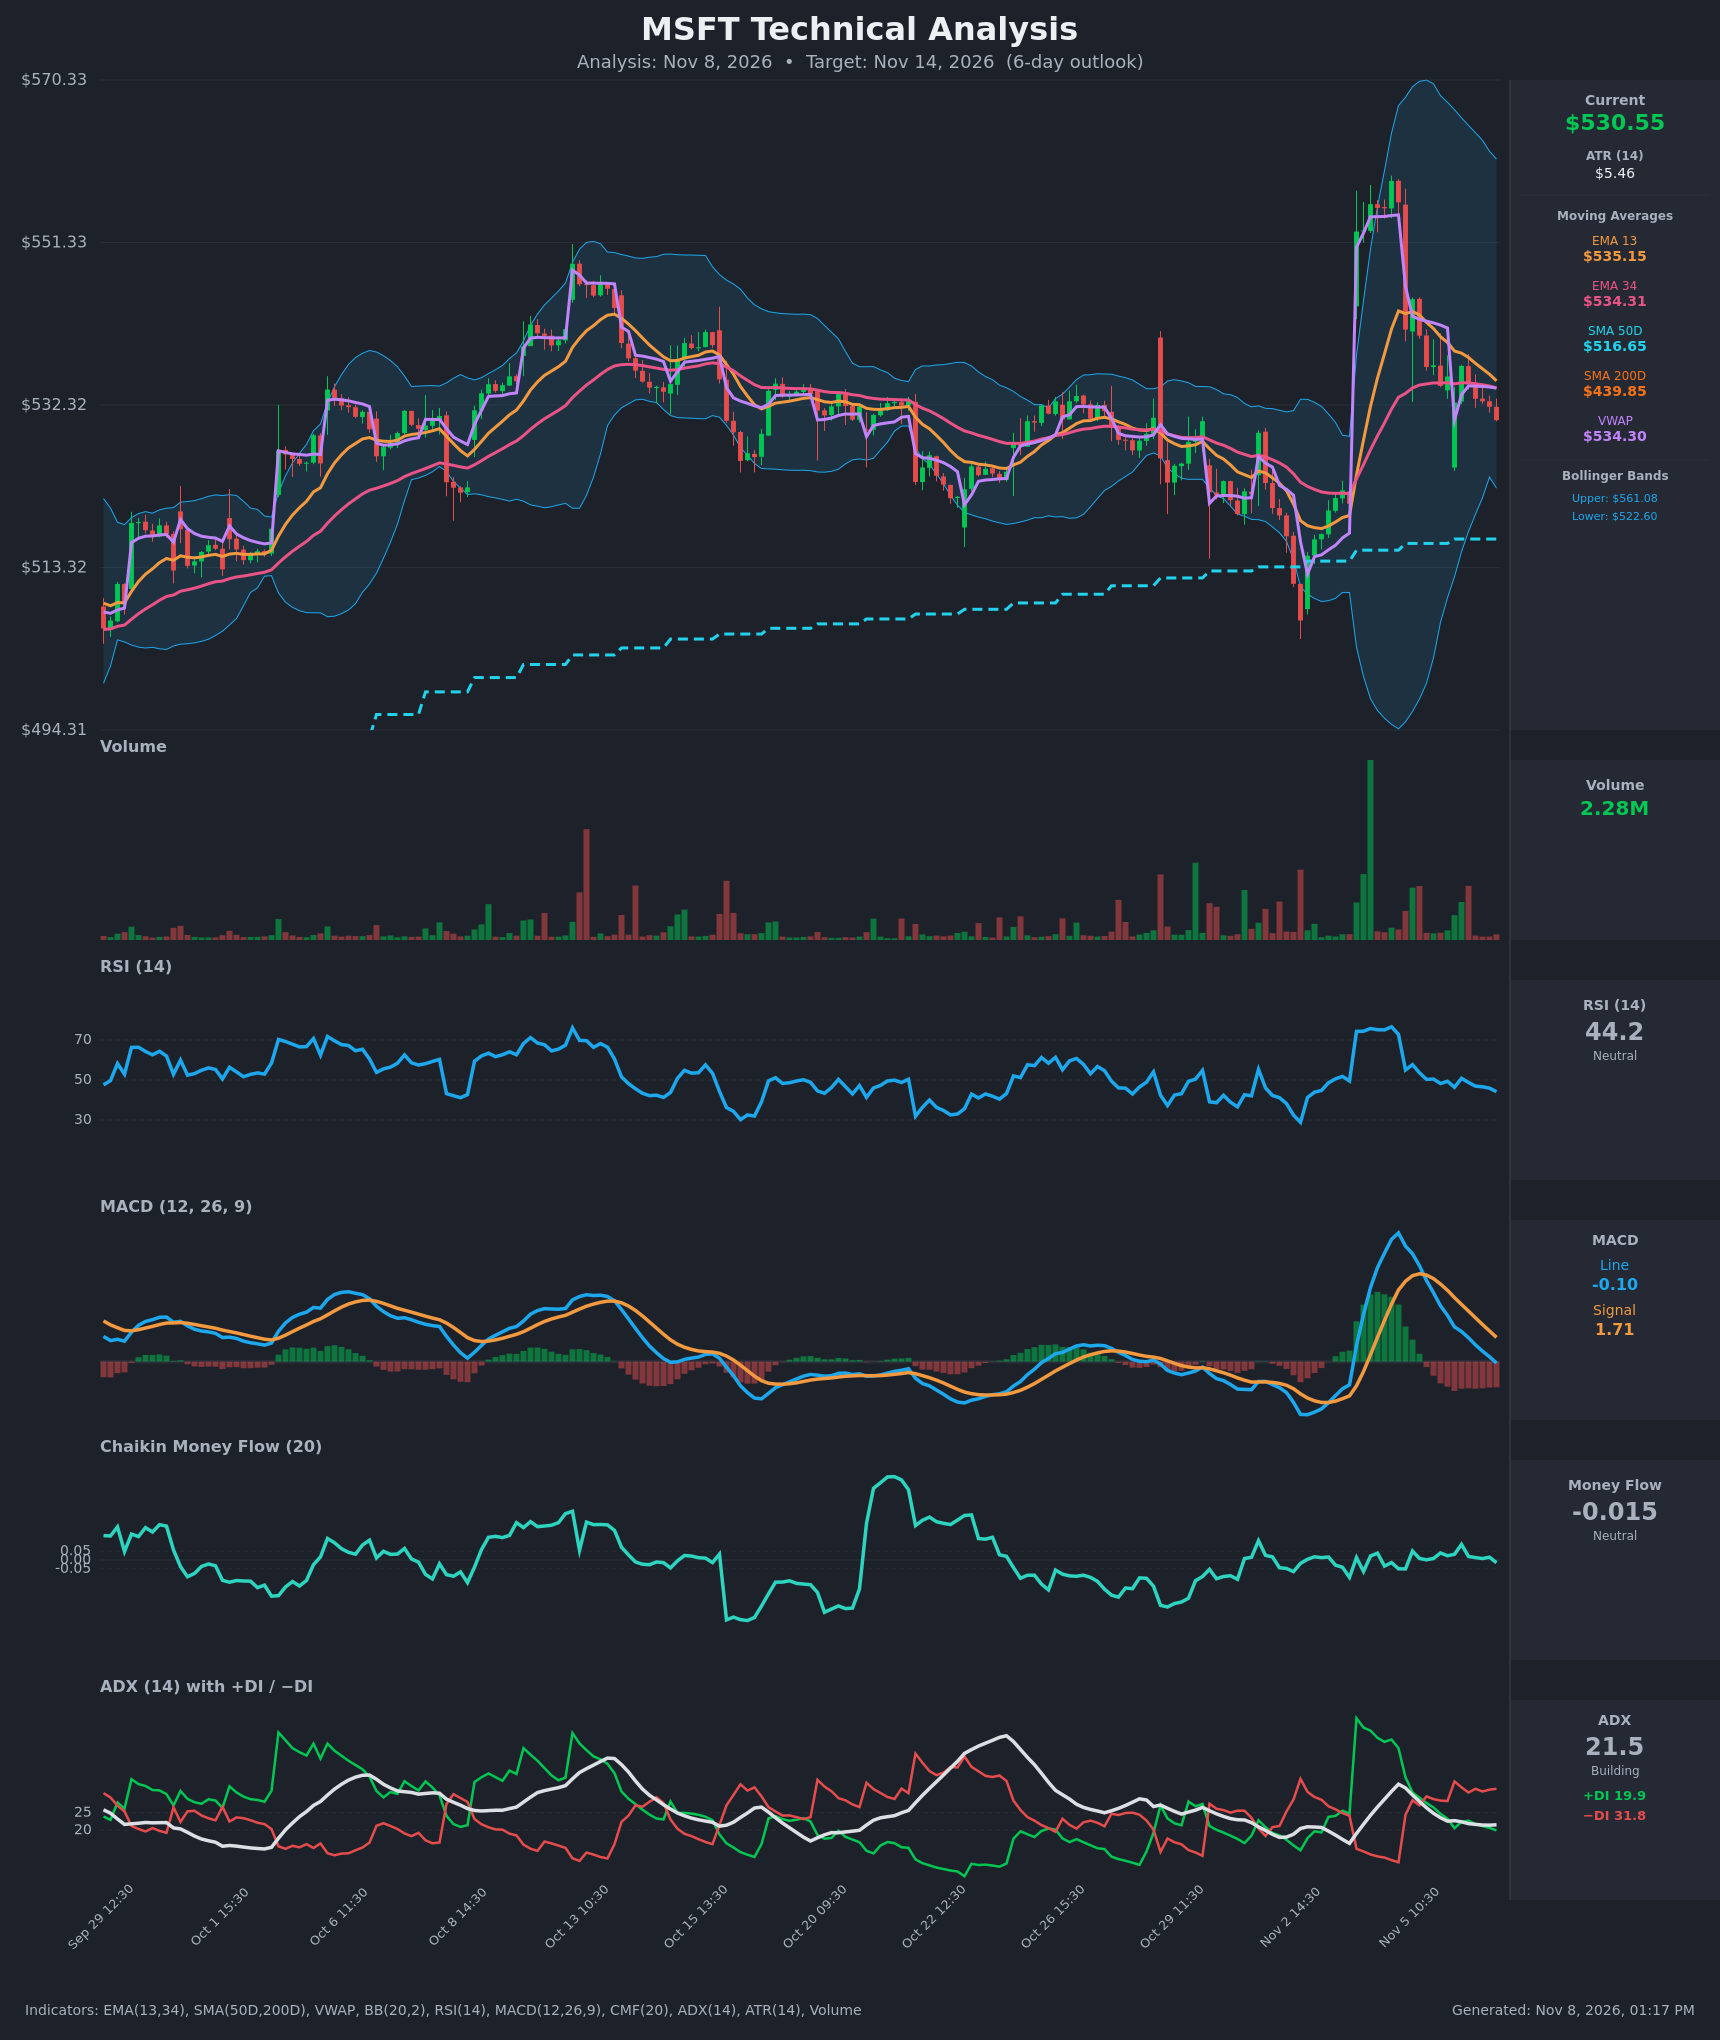
- RSI (14): 44.15, down from 72.8 on Nov 4 and drifting lower through the 50 midline. Momentum is fading but not oversold. [Bearish]
- 20 EMA: The chart shows EMA 13 at $535.15 and EMA 34 at $534.31, so I use these as the short-term trend proxies. Price at $530.55 is below both, and EMA 13 is sloping down toward EMA 34 (a bearish crossover is imminent). Both act as overhead resistance around $534-535. [Bearish]
- MACD: Line at -0.10, signal at 1.71, so the line is below the signal and has just crossed below zero. The histogram is negative (about -1.8) and widening. It crossed down from the +9 peak on Nov 4. [Bearish]
- Bollinger Bands (20): Upper $561.08, lower $522.60, midline around $541.8. Price is in the lower half, about 21% of the way up the band range, and the bands remain wide after the earnings-gap spike. The lower band at $522.60 is a nearby downside magnet. [Bearish]
- CMF (20): -0.015, inside the ±0.05 neutral zone. It has hovered near zero with no sustained accumulation or distribution. [Neutral]
- ADX (14): 21.5 with −DI (31.8) well above +DI (19.9). The trend is weak-to-moderate but the directional bias favors sellers, and −DI has held the upper hand since Nov 5. [Weak Trend, Bearish Direction]
- Volume: 2.28M on the latest bar, which is average to light. Volume has faded since the huge spike on the gap-up, and the recent down bars show mild selling without capitulation. [Neutral to Mildly Bearish]
DIVERGENCES & TRENDS
- There is no clear divergence. Price is making lower highs and lower lows since the Nov 4 peak ($556), and RSI and MACD are confirming that decline.
- Price has fully retraced the post-earnings gap rally from about $556 down to $530, and the momentum indicators have rolled over with it.
- MACD has crossed below its signal line and then below zero, which is a bearish momentum shift. The histogram is expanding negative.
- EMA 13 has crossed below VWAP ($534.30) and is converging on EMA 34, so a bearish EMA crossover is likely within a bar or two.
- −DI has crossed above +DI and the gap is widening, while ADX is hovering near 21.5 (weak).
- Long-term structure stays constructive. Price is above SMA50D ($516.65) and well above SMA200D ($439.85), with the 50D above the 200D (golden cross in place). This points to a pullback inside a larger uptrend.
CHART PATTERNS
- The Nov 4 spike and the quick reversal look like a failed breakout. Price is now inside the earlier $520-$545 range, which resembles a Bearish Double Top structure against the Oct 13 high around $547, with a lower-high sequence since.
- Price is also making a series of lower highs and lower lows from $544.69 down to $530.55. This resembles a Bearish Flag/Descending channel, with a measured move toward the lower Bollinger Band and the prior consolidation floor near $522.
- The first target is the lower band at about $522.60. The next support is near $513-$516 (SMA50D zone and the Oct 31 low area). A reclaim of $535 would negate the setup.
POTENTIAL SCENARIOS
- Scenario 1: Bearish Continuation Toward the Lower Band — Momentum rolled over, −DI dominates, and EMA 13 is about to cross below EMA 34, so a drift lower to the bottom of the range is the path of least resistance. Trigger: break below $528 on a hourly close. Target: $522-$524, with extension to $518. Invalidation: close above $535.50 (EMA 13/VWAP). (55% probability)
- Scenario 2: Neutral Range Chop — Weak ADX (21.5) and neutral CMF allow a rebound to the moving averages and sideways action between support and the EMAs. Trigger: price holds $526-$527 and RSI stabilizes near 40-45. Target: $528-$535. Invalidation: close outside $524-$536. (25% probability)
- Scenario 3: Bullish Mean-Reversion Bounce — The dip finds buyers above the SMA50D uptrend structure, and price recovers the EMA cluster. Trigger: close above $535.50 with MACD histogram turning up. Target: $541-$543 (BB midline). Invalidation: loss of $526. (20% probability)
PRICE TARGETS
- Target Price: $524.50 (6-day horizon, about 1.1% below the current price, roughly 1 ATR of drift lower)
- Expected Range: $513.50 to $540.00 (width $26.50, about 5.0% of the current price, in line with the ~4-8% guidance for 6-10 days)
- Key Levels: Support at $522.60 (lower Bollinger Band), Resistance at $535.15 (EMA 13 / VWAP cluster)
OVERALL BIAS
OVERALL BIAS: BEARISH - MACD has crossed below its signal and zero line, RSI is falling through 50, −DI (31.8) dominates +DI (19.9), and price sits below the EMA 13/34 and VWAP, which now act as resistance. The larger uptrend (above the 50D and 200D) should limit the downside to the $522 to $516 area.
This is educational analysis and not financial advice.