MSFT 4-day bearish forecast — Nov 8, 2026
- Bias: Bearish
- Timeframe: 4 days (made Nov 8, 2026, target date Nov 11, 2026)
- Price at analysis: $530.55
- Price target: $526.50
- Expected range: $517.50 – $538.00
- Result: Correct (-2.0%) — closed at $519.90 on Nov 11, 2026; quality score 100/100
Get a free AI analysis of MSFT today
Analysis
TECHNICAL INDICATORS
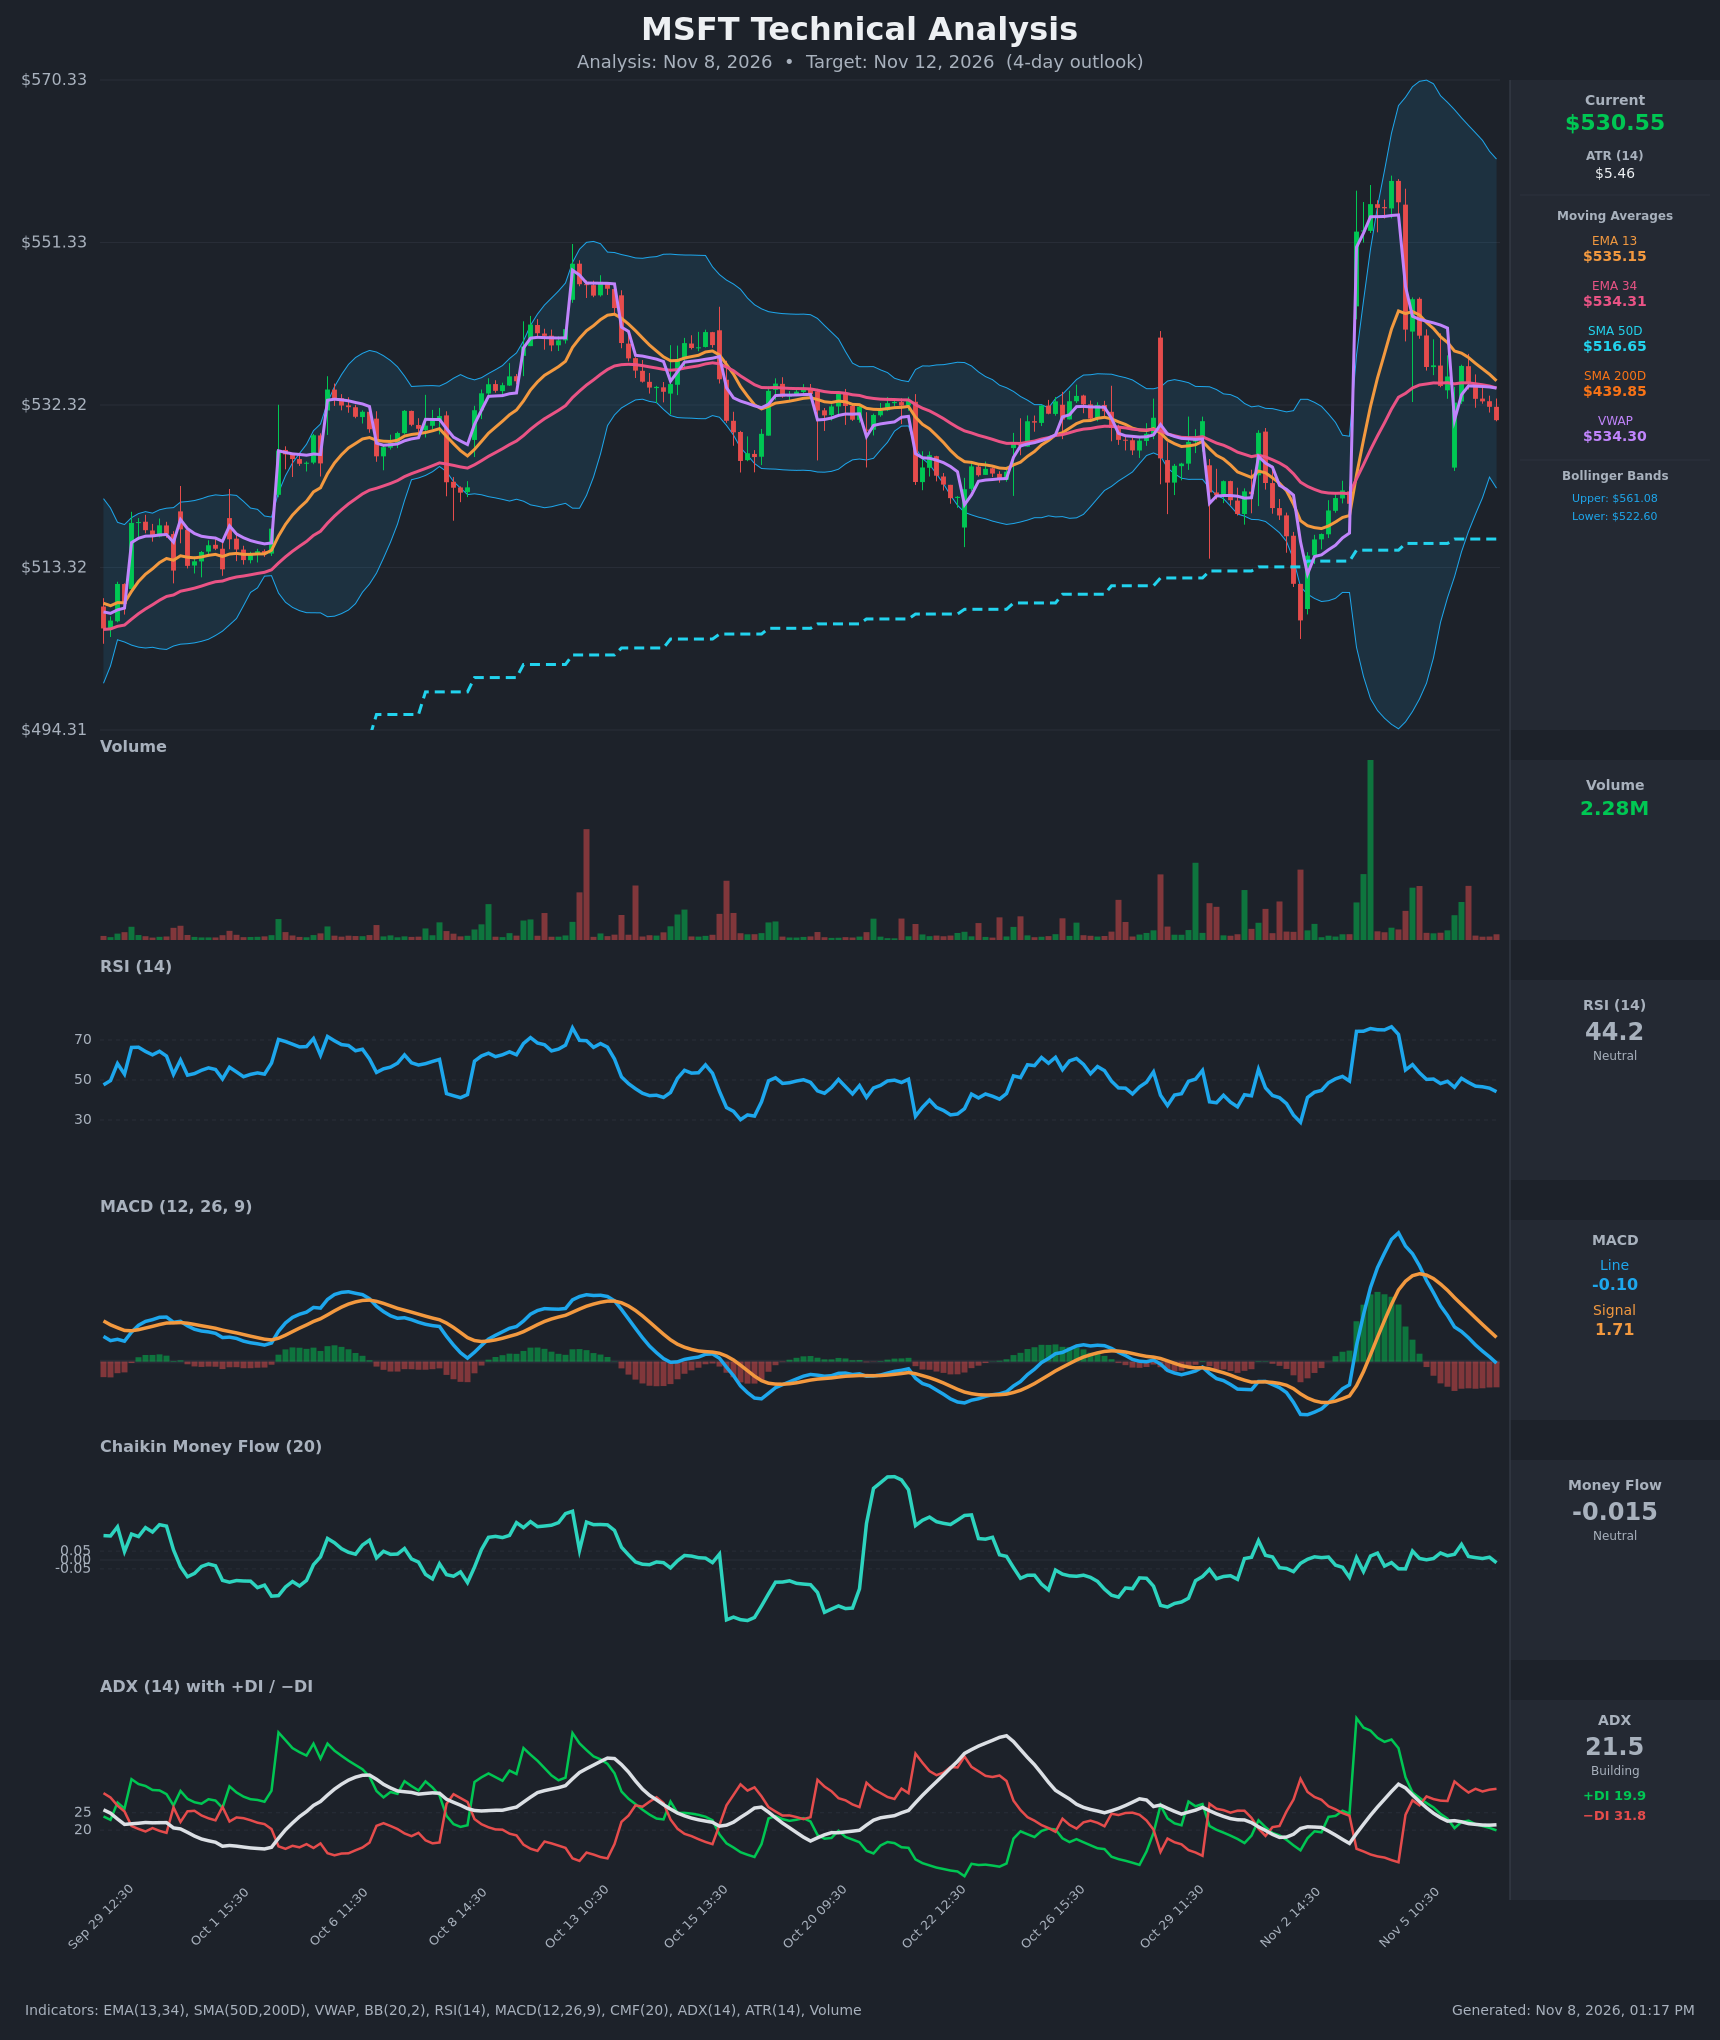
- RSI (14): 44.15 and falling from the 72.8 spike on Nov 4. It is below the 50 midline and has made lower readings every session (50.8, 48.8, 46.9, 45.9, 44.2). It is not oversold, so there is room to fall further. [Bearish]
- 20 EMA: The chart shows EMA 13 at $535.15 and EMA 34 at $534.31. Price at $530.55 is below both, so they act as overhead resistance. EMA 13 is still above EMA 34, but the gap has narrowed to under $1, and a bearish cross looks likely. [Bearish]
- MACD: The line (-0.10) has just crossed below the signal (1.71). The histogram has turned negative and is expanding, which marks a fresh bearish crossover after the early-November spike faded. [Bearish]
- Bollinger Bands (20): The upper band is at $561.08 and the lower band at $522.60. The bands are very wide after the Nov 4 spike. Price sits in the lower half, about $8 above the lower band and below the midline of roughly $541.8. The bands are now contracting from the extreme expansion, and price is drifting toward the lower band. [Bearish]
- CMF (20): -0.015, within the neutral zone (±0.05). It has hovered around zero with no clear accumulation or distribution. [Neutral]
- ADX (14): 21.5, with -DI (31.8) well above +DI (19.9). The trend is weak to moderate, but the bears are in control, and -DI has led since Nov 5 midday. [Weak Trend, Bearish Direction]
- Volume: 2.28M, ordinary and well below the huge spike bar on the Nov 3-4 rally. The recent decline has come on unremarkable volume, so there is no capitulation and no strong conviction either way. [Neutral/Mildly Bearish]
Price is also below VWAP ($534.30), a mild sign of selling pressure. It remains far above the SMA50 ($516.65) and SMA200 ($439.85), so the long-term uptrend is intact.
DIVERGENCES & TRENDS
- There is no clear divergence. RSI and MACD are making lower highs and lower lows in step with price pulling back from the Nov 4 peak.
- Momentum is rolling over. The MACD crossed below its signal on Nov 6, RSI has declined steadily for 2 days, and the DI spread has flipped to -DI dominance.
- ADX is flat to slightly declining near 21.5, so this is a weak-trend pullback rather than a strong downtrend.
- EMA 13 is converging on EMA 34 (a bearish crossover is nearly complete). Price has made lower highs on each bounce since Nov 5 and keeps closing under VWAP.
- The golden cross is long established (SMA50 > SMA200). Price is far above SMA200, which supports dip-buying in the longer term.
CHART PATTERNS
- After the gap-up spike, price has formed a series of lower highs and lower lows, a short-term Bearish Flag/Pennant-style consolidation or Bearish Rising Wedge-type pullback. The pattern is not textbook.
- The spike-and-fade looks like a failed breakout. The area around $532-$535 (EMA cluster, VWAP) has become resistance.
- The measured move points to the lower Bollinger Band and the gap-fill area around $520-$523. Below that sits the Oct 28-30 swing low near $510-$513.
POTENTIAL SCENARIOS
- Scenario 1: Bearish Continuation Toward Lower Band — Price is rejected under the EMA 13/34 and VWAP cluster, the MACD histogram keeps expanding, and -DI stays dominant. Trigger: break below $528 on rising volume. Target: $521-$524 (lower Bollinger Band). Invalidation: a close above $535.5. (55% probability)
- Scenario 2: Neutral Range Chop — Price consolidates between the lower band and the EMAs as ADX stays near 21 and CMF stays near zero. Trigger: holding the $526-$534 zone. Target: $529-$533. Invalidation: a break outside $524-$536. (25% probability)
- Scenario 3: Bullish Dip-Buy Rebound — Buyers defend the dip above the rising SMA50 trend and the lower band, and price reclaims the EMAs and VWAP. Trigger: a close above $535.5 with improving RSI above 50. Target: $540-$542 (Bollinger midline). Invalidation: a break below $524. (20% probability)
PRICE TARGETS
- Target Price: $526.50 (4-day timeframe)
- Expected Range: $517.50 to $538.00 (a $20.50 width, about 3.9% of the current price, in line with a 2-4 day timeframe)
- Key Levels: Support at $522.60 (lower Bollinger Band), Resistance at $535.15 (EMA 13/VWAP zone)
OVERALL BIAS
OVERALL BIAS: BEARISH - A fresh bearish MACD crossover, falling RSI, -DI well above +DI, and price trading below the EMAs and VWAP point to a drift toward the lower Bollinger Band. The weak ADX and the long-term uptrend limit the downside.
This is educational analysis and not financial advice.