NBIS 6-day bearish forecast — Nov 8, 2026
- Bias: Bearish
- Timeframe: 6 days (made Nov 8, 2026, target date Nov 13, 2026)
- Price at analysis: $129.44
- Price target: $125.50
- Expected range: $122.00 – $132.50
- Result: Correct (-12.8%) — closed at $112.90 on Nov 13, 2026; quality score 50/100
Get a free AI analysis of NBIS today
Analysis
TECHNICAL INDICATORS
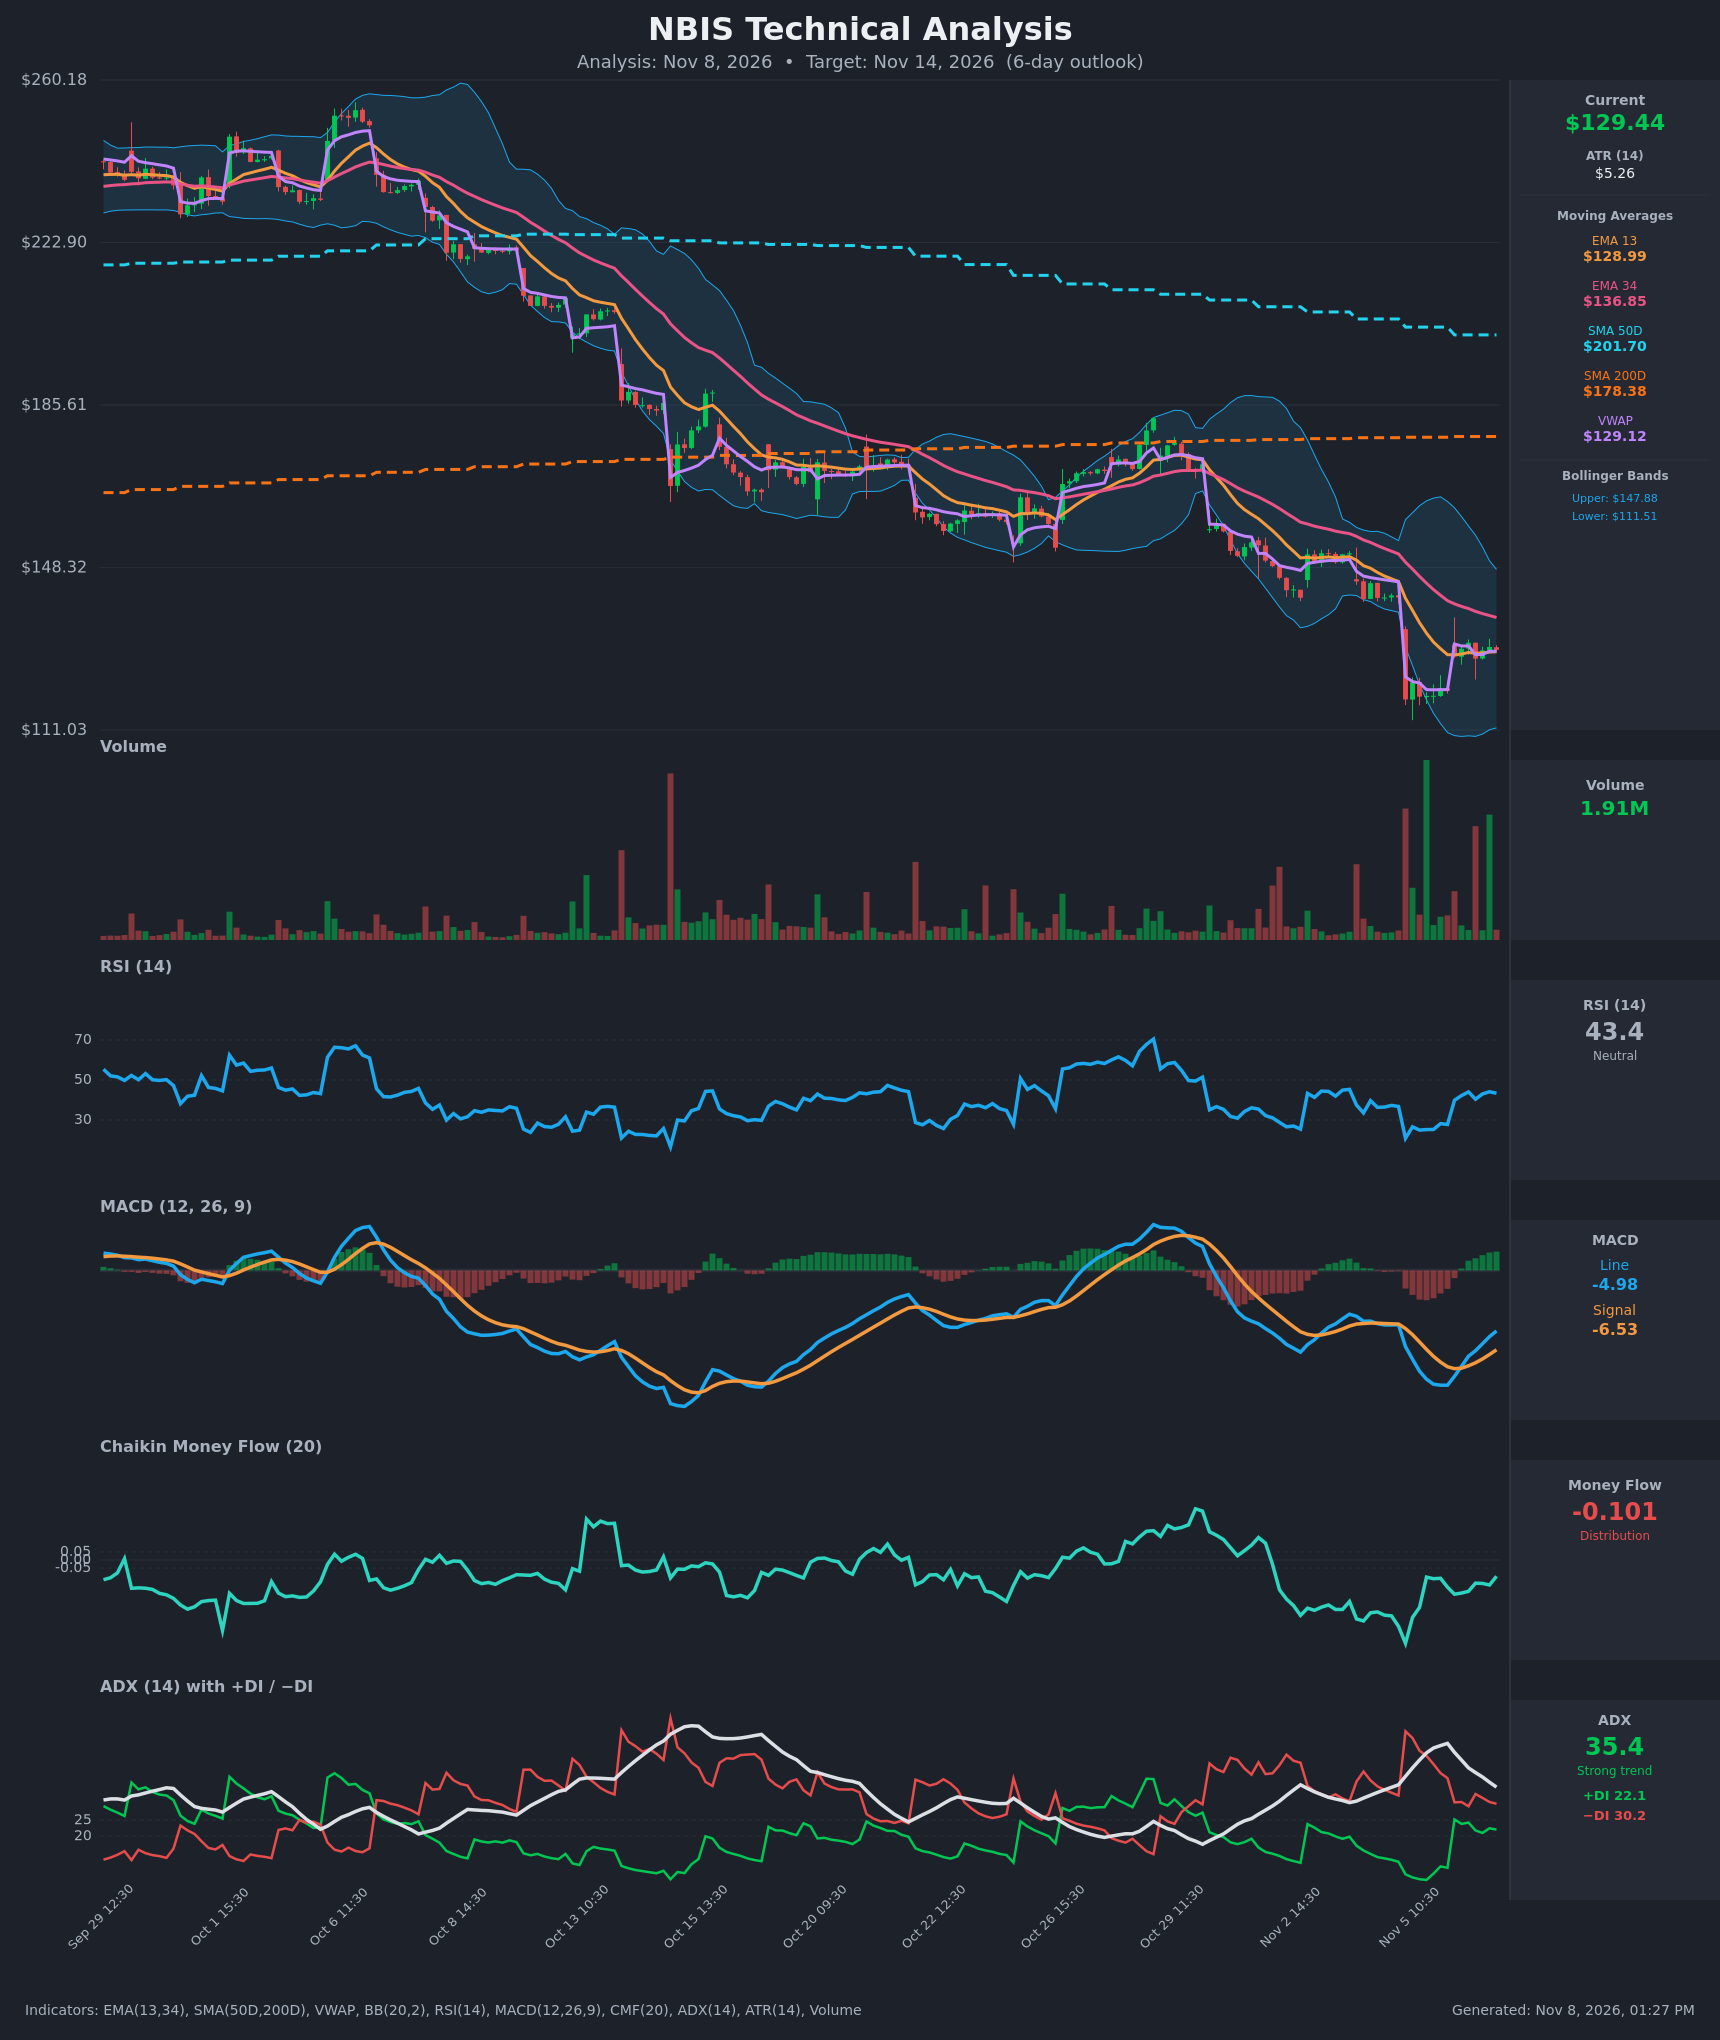
- RSI (14): 43.38, up from a 20.9 oversold low on Nov 5 and now back under the 50 midline. Momentum has recovered from the washout, but RSI has not reclaimed 50 and is still in a bearish regime. [Neutral]
- 20 EMA: The chart shows EMA 13 at $128.99 and EMA 34 at $136.85, with price at $129.44. Price is hugging the EMA13 (flat, no edge) and sits well below the EMA34, which has been falling steadily and is the first real overhead resistance. EMA13 is below EMA34, so the bearish cross is intact. [Bearish]
- MACD: Line -4.98 is above signal -6.53, and the histogram is rising toward zero. The bullish crossover happened on Nov 6 10:30, but both lines are still deep below zero. This is a relief bounce inside a downtrend, not a confirmed reversal. [Neutral]
- Bollinger Bands (20): Upper $147.88, lower $111.51, midline about $129.70. Price sits right on the midline after bouncing from the lower band during the Nov 5 gap-down. The bands are wide (about 28% of price), so volatility is elevated. The midline is a coin-flip pivot, and the downward-sloping middle band favors sellers. [Neutral]
- CMF (20): -0.101, below -0.05 and negative for most of the past month. The latest uptick has not turned positive. Distribution is still in control. [Distribution]
- ADX (14): 35.4 with -DI 30.2 above +DI 22.1. ADX has been fading from a peak near 49 (Nov 5), so the downtrend is losing some energy. The gap between +DI and -DI has narrowed sharply from 8 vs 53. A strong trend still favors the bears. [Strong Trend – Bearish]
- Volume: 1.91M on the latest bar. Huge volume spikes came on the Nov 5 breakdown and the first bounce. The recent consolidation bars carry lighter volume, consistent with a pause or flag rather than aggressive accumulation. [Mild bearish / no accumulation]
- VWAP / SMAs: VWAP is $129.12 and price is just above it, which is neutral. SMA50D ($201.70) is far above SMA200D ($178.38), and the SMA50D is falling toward the SMA200D, which points to a looming death cross. Price is below both SMAs, a long-term downtrend. [Bearish]
DIVERGENCES & TRENDS
- Price made a new low on Nov 5 at about $118, while RSI printed a sharply oversold 20.9. The subsequent higher RSI with a flat price is a minor momentum improvement, not a true bullish divergence.
- MACD crossed bullish while still below zero. That usually marks a counter-trend bounce.
- ADX is rolling over from its peak and the DI spread is narrowing. The downtrend is decelerating but not reversed.
- EMA13 below EMA34 (bearish), price below the SMA200D (bearish), and a death cross is approaching.
- CMF is stuck negative with no recovery, so volume flow does not confirm the bounce.
- The structural trend is lower highs and lower lows from the $250s down to $129. The Nov 6 bounce failed to reclaim the EMA34.
CHART PATTERNS
- Bearish Pennant / Flag (continuation): After the sharp Nov 5 gap-down (about $141 to $118), price has consolidated in a tight $127–131 range on lighter volume with a slight upward drift. This matches the bearish flag/pennant in the reference diagram. A break below the consolidation low (about $127) would resume the downtrend. Near-term targets are the gap low at $118–120, and the lower Bollinger Band at $111.5 if it extends.
- The larger structure is a persistent descending channel with lower highs. A confirmed bullish reversal would need a close above the EMA34 (about $137) and a move back above $141 (the pre-gap level). Neither has happened.
POTENTIAL SCENARIOS
- Scenario 1: Bearish Flag Breakdown — The tight consolidation resolves lower in line with the dominant downtrend (-DI > +DI, CMF negative, below all key MAs). Trigger: close below $127.40 (consolidation low) and below VWAP. Target: $121–$125, with possible tests of $118. Invalidation: close above $134 and the EMA34 at $136.85. (50% probability)
- Scenario 2: Bullish Relief Rally — The MACD crossover and recovering RSI extend the oversold bounce toward the falling EMA34. Trigger: break above $131.50 on rising volume. Target: $135–$137, where the EMA34 should cap it. Invalidation: close back below $127. (33% probability)
- Scenario 3: Neutral Range-Bound Chop — Price keeps oscillating around the EMA13, VWAP and BB midline between $127 and $132. Trigger: low-volume drift with no break. Target: $128–$131. Invalidation: a close outside $126–$133. (17% probability)
PRICE TARGETS
Timeframe: 6 days (range scaled to about 8% of price; width is $10.50 / $129.44 ≈ 8.1%).
- Target Price: $125.50 (6 days from now)
- Expected Range: $122.00 to $132.50
- Key Levels: Support at $118.00 (Nov 5 gap low), Resistance at $136.85 (EMA34)
OVERALL BIAS
OVERALL BIAS: BEARISH - The price is in a strong, established downtrend (ADX 35 with -DI above +DI). It is below the EMA34, SMA50D and SMA200D, with CMF in distribution, and the tight post-gap consolidation looks like a bearish flag/pennant. The MACD crossover and RSI recovery argue for a possible relief bounce toward $136–137, but the EMA34 should cap it, which leaves a modest downside tilt.
This is educational analysis and not financial advice.