RKLB 4-day bullish forecast — Nov 8, 2026
- Bias: Bullish
- Timeframe: 4 days (made Nov 8, 2026, target date Nov 11, 2026)
- Price at analysis: $53.05
- Price target: $54.60
- Expected range: $52.00 – $56.00
- Result: Correct (+21.8%) — closed at $64.61 on Nov 11, 2026; quality score 50/100
Get a free AI analysis of RKLB today
Analysis
TECHNICAL INDICATORS
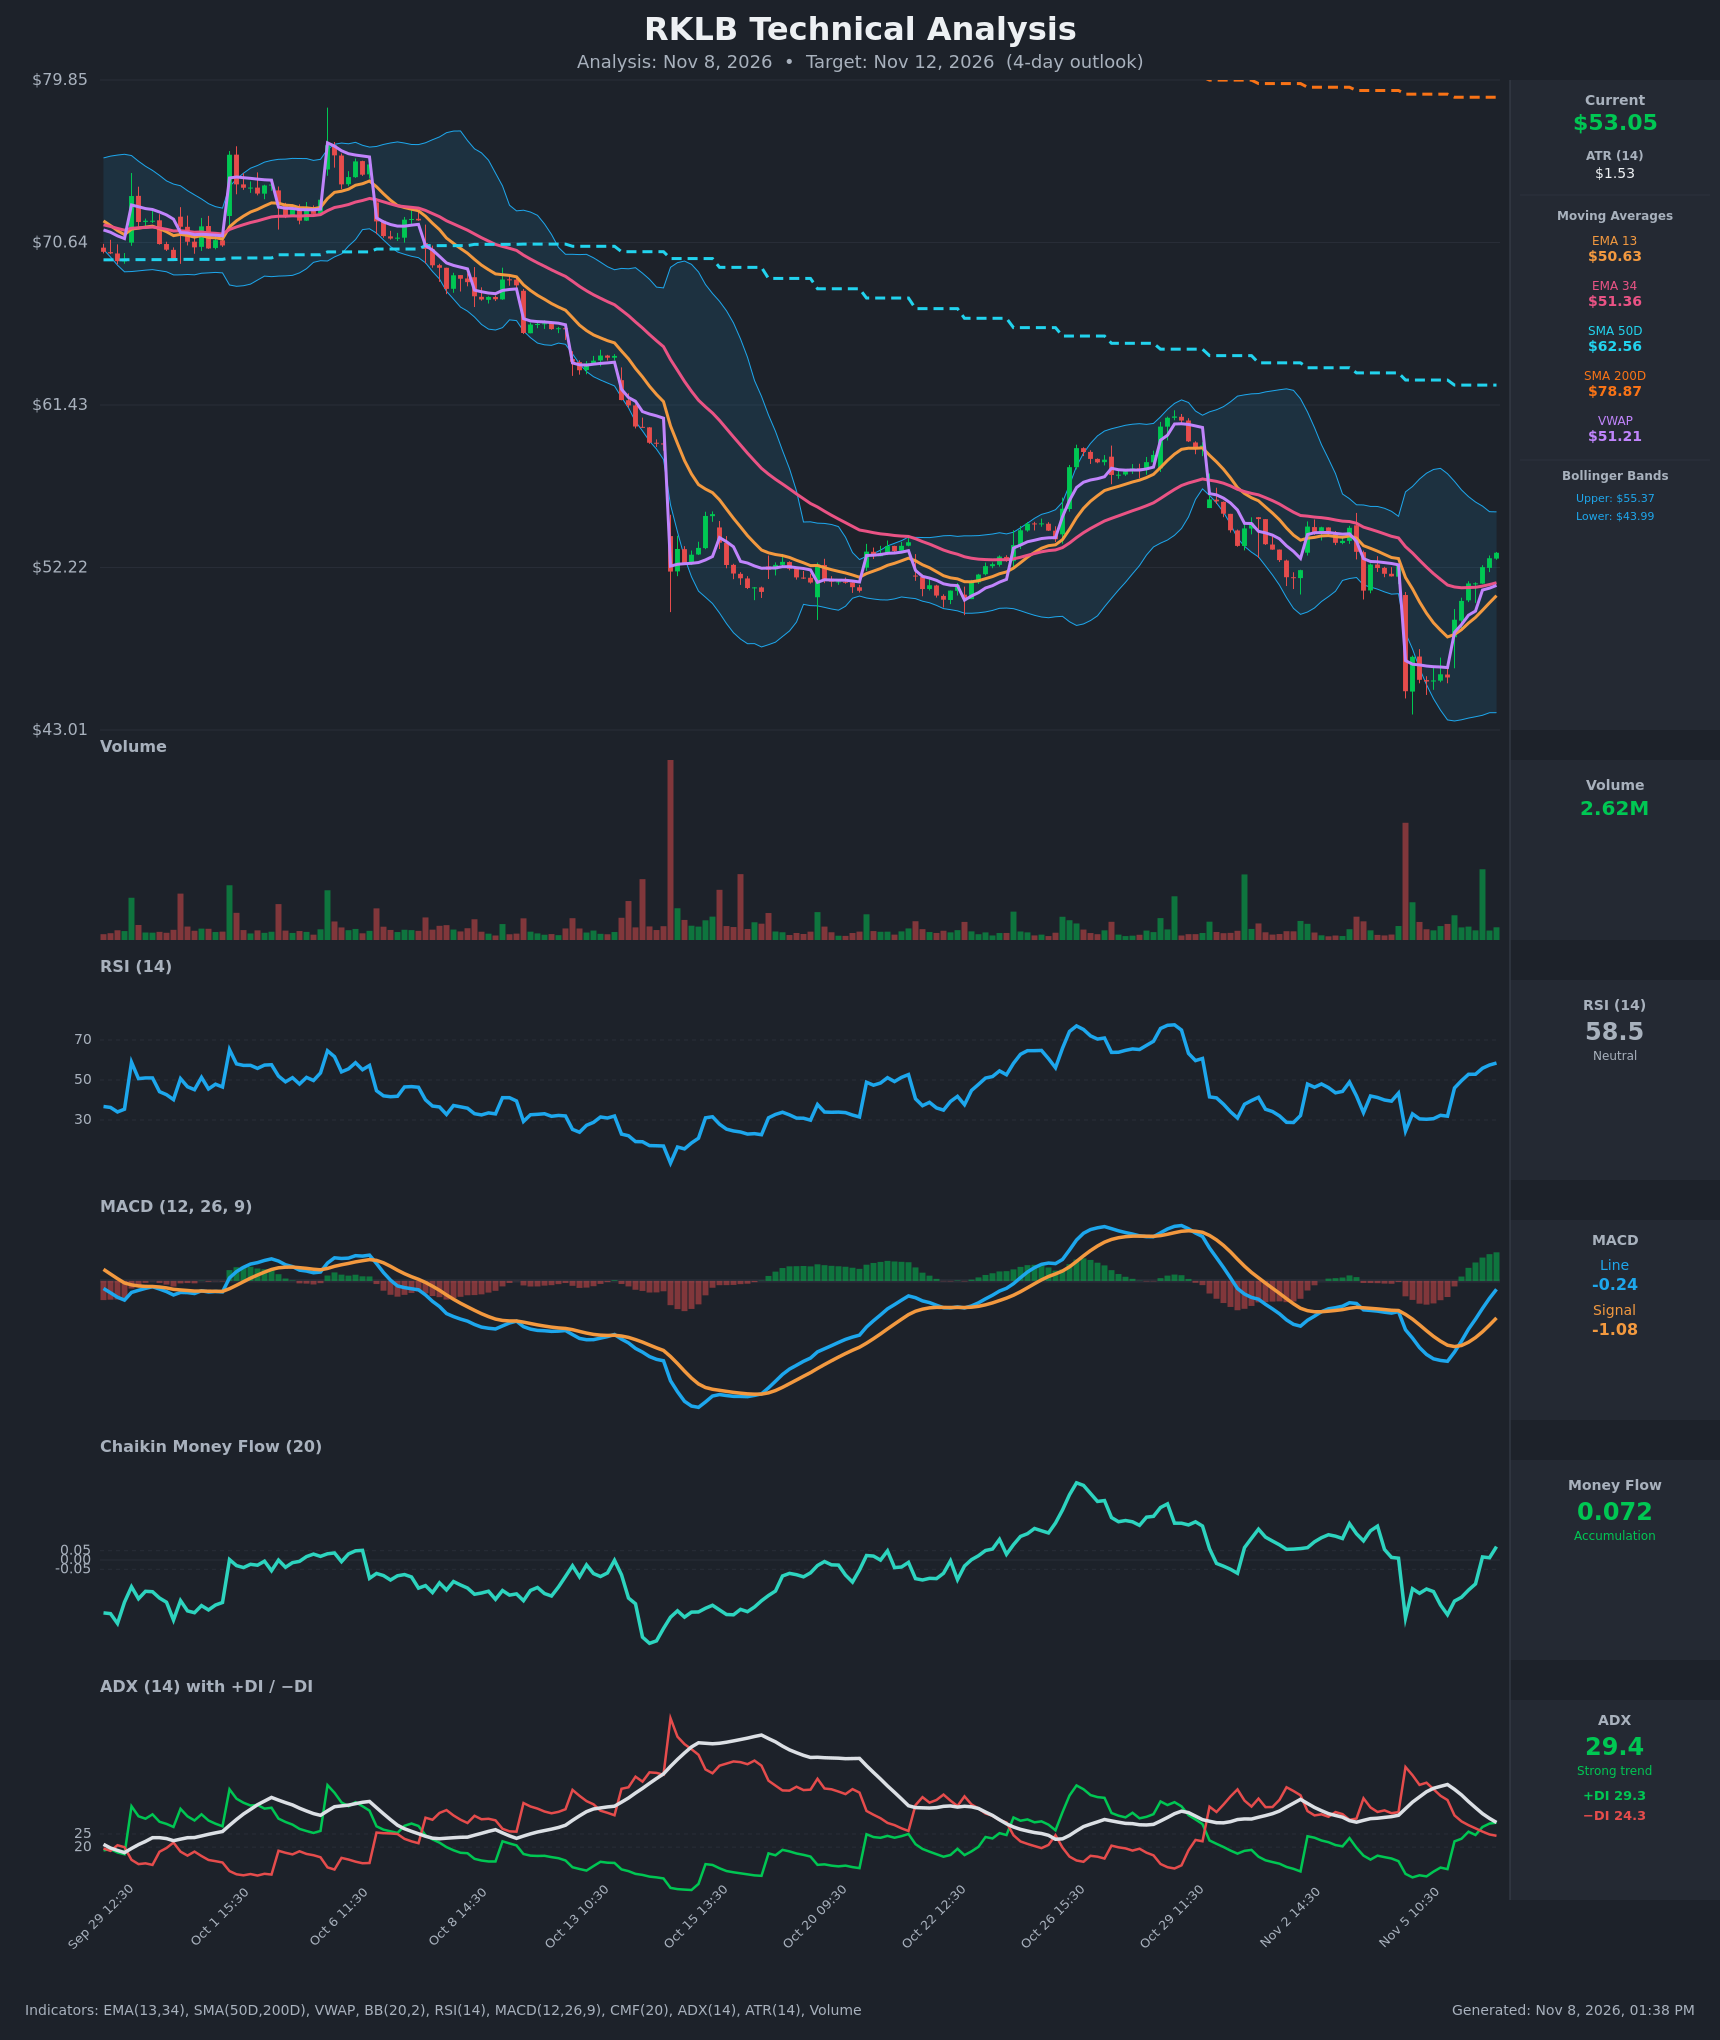
- RSI (14): 58.49, up from the 24.5 capitulation low on Nov 5 and rising steadily through the 50 midline. It is not yet overbought, so there is room to run. [Bullish]
- 20 EMA: The supplied EMAs are 13/34. EMA13 is $50.63 and EMA34 is $51.36, and price at $53.06 is above both, so they act as dynamic support. EMA13 is rising sharply but still below EMA34, so there is no bullish crossover yet. [Bullish]
- MACD: Line -0.24 is above signal -1.08, a bullish crossover that happened around Nov 6 10:30. The histogram is positive (about +0.83) and expanding. The lines are still below zero, so this is a recovery rather than a confirmed trend change. [Bullish]
- Bollinger Bands (20): Upper $55.37, lower $43.99, with price near the upper half (about 0.8 of the band width). The bands are wide after the Nov 5 selloff. Price has bounced from the lower band toward the upper band, so $55.37 is the near-term test. [Bullish]
- CMF (20): 0.072, just back above the +0.05 threshold after weeks of negative or flat readings. This is early accumulation, though it is not yet a sustained trend. [Accumulation]
- ADX (14): 29.4 and falling from 43.7. +DI (29.3) has just crossed above −DI (24.3), so bulls have taken control. The falling ADX means the prior bearish trend is exhausting, and the new bullish trend is not yet established. [Strong Trend, turning Bullish]
- Volume: 2.62M on the latest bar. Volume has been modest on the green recovery bars after the huge red capitulation bar on Nov 5. The bounce lacks heavy volume conviction, but it is not being sold into aggressively. Price is also above VWAP ($51.21). [Mildly Bullish / Neutral]
DIVERGENCES & TRENDS
- No clear price/indicator divergence. RSI, MACD and CMF all turned up with price, so they confirm the bounce.
- Price made a lower low on Nov 5 (~$45) with RSI at 24.5, an oversold washout followed by a sharp V-shaped reversal.
- MACD bullish crossover with a rising histogram, and +DI crossing above −DI, both support near-term upside.
- The larger structure is still bearish. Price is far below SMA50 ($62.56) and SMA200 ($78.87), and SMA50 is below SMA200 (death cross already in place). Both slope down and cap rallies.
- EMA13 is still below EMA34. A bullish crossover is likely within a few sessions if price holds, but it has not happened yet.
- The CMF jump above +0.05 is fresh and could fade.
CHART PATTERNS
- V-shaped reversal / capitulation bounce: This follows the gap-down and oversold flush. It is not a classic diagram pattern, but it resembles the start of a Bullish Double Bottom (the Oct 22 low near $50 and the Nov 5 low near $45). The neckline would be around $55–56, which matches the upper Bollinger Band and a prior gap zone. A close above it would project toward $58–60.
- Bearish Flag / Rising Wedge risk (continuation): In the broader downtrend, the bounce from $45 could be a corrective rally. Failure near $55–56 with a rollover would fit a bearish flag, with a measured target back toward $46–48.
- The pattern evidence is mixed. The short-term momentum edge favors the bounce, but the overhead resistance is heavy.
POTENTIAL SCENARIOS
- Scenario 1: Bullish Continuation of the Relief Rally — Price holds above the EMA13/VWAP cluster and pushes toward the upper Bollinger Band as momentum builds and EMA13 crosses above EMA34. Trigger: hold above $51.50 and break above $55.00 on rising volume. Target: $55.40–$56.50. Invalidation: a close below $50.60 (EMA13). (50% probability)
- Scenario 2: Bearish Rejection at Resistance — The bounce stalls at the upper band and the SMA50-driven downtrend reasserts itself, with a pullback to the EMA/VWAP cluster or lower. Trigger: rejection at $55–56 followed by a break below $51.20. Target: $49.50–$51.00. Invalidation: a sustained close above $56.50. (30% probability)
- Scenario 3: Neutral Consolidation — Price digests the 17% bounce between the moving-average cluster and the upper band. Trigger: ADX continues to fade with no break of $51.30 or $55.40. Target: $52.50–$54.00. Invalidation: a break outside $51.00–$56.00. (20% probability)
PRICE TARGETS
Range width check: $56.00 − $52.00 = $4.00, about 7.5% of the $53.06 price. This is wider than a 2–3 day range, reflecting RKLB's high volatility (ATR $1.53) and the wide Bollinger Bands, but it is narrower than a 7–10 day range would be.
- Target Price: $54.60 (4-day)
- Expected Range: $52.00 to $56.00
- Key Levels: Support at $51.30 (EMA34/VWAP zone), Resistance at $55.37 (upper Bollinger Band)
OVERALL BIAS
OVERALL BIAS: BULLISH - The MACD bullish crossover with a rising histogram, +DI crossing above −DI, CMF turning positive, and price above the EMA13, EMA34 and VWAP support a continued short-term relief rally toward the $55 upper band. Conviction is modest because price is still well below the declining SMA50 and SMA200, and resistance near $55–56 could cap gains.
This is educational analysis and not financial advice.