RKLB 6-day bullish forecast — Nov 8, 2026
- Bias: Bullish
- Timeframe: 6 days (made Nov 8, 2026, target date Nov 13, 2026)
- Price at analysis: $53.05
- Price target: $54.40
- Expected range: $51.00 – $55.40
- Result: Correct (+13.1%) — closed at $60.00 on Nov 13, 2026; quality score 50/100
Get a free AI analysis of RKLB today
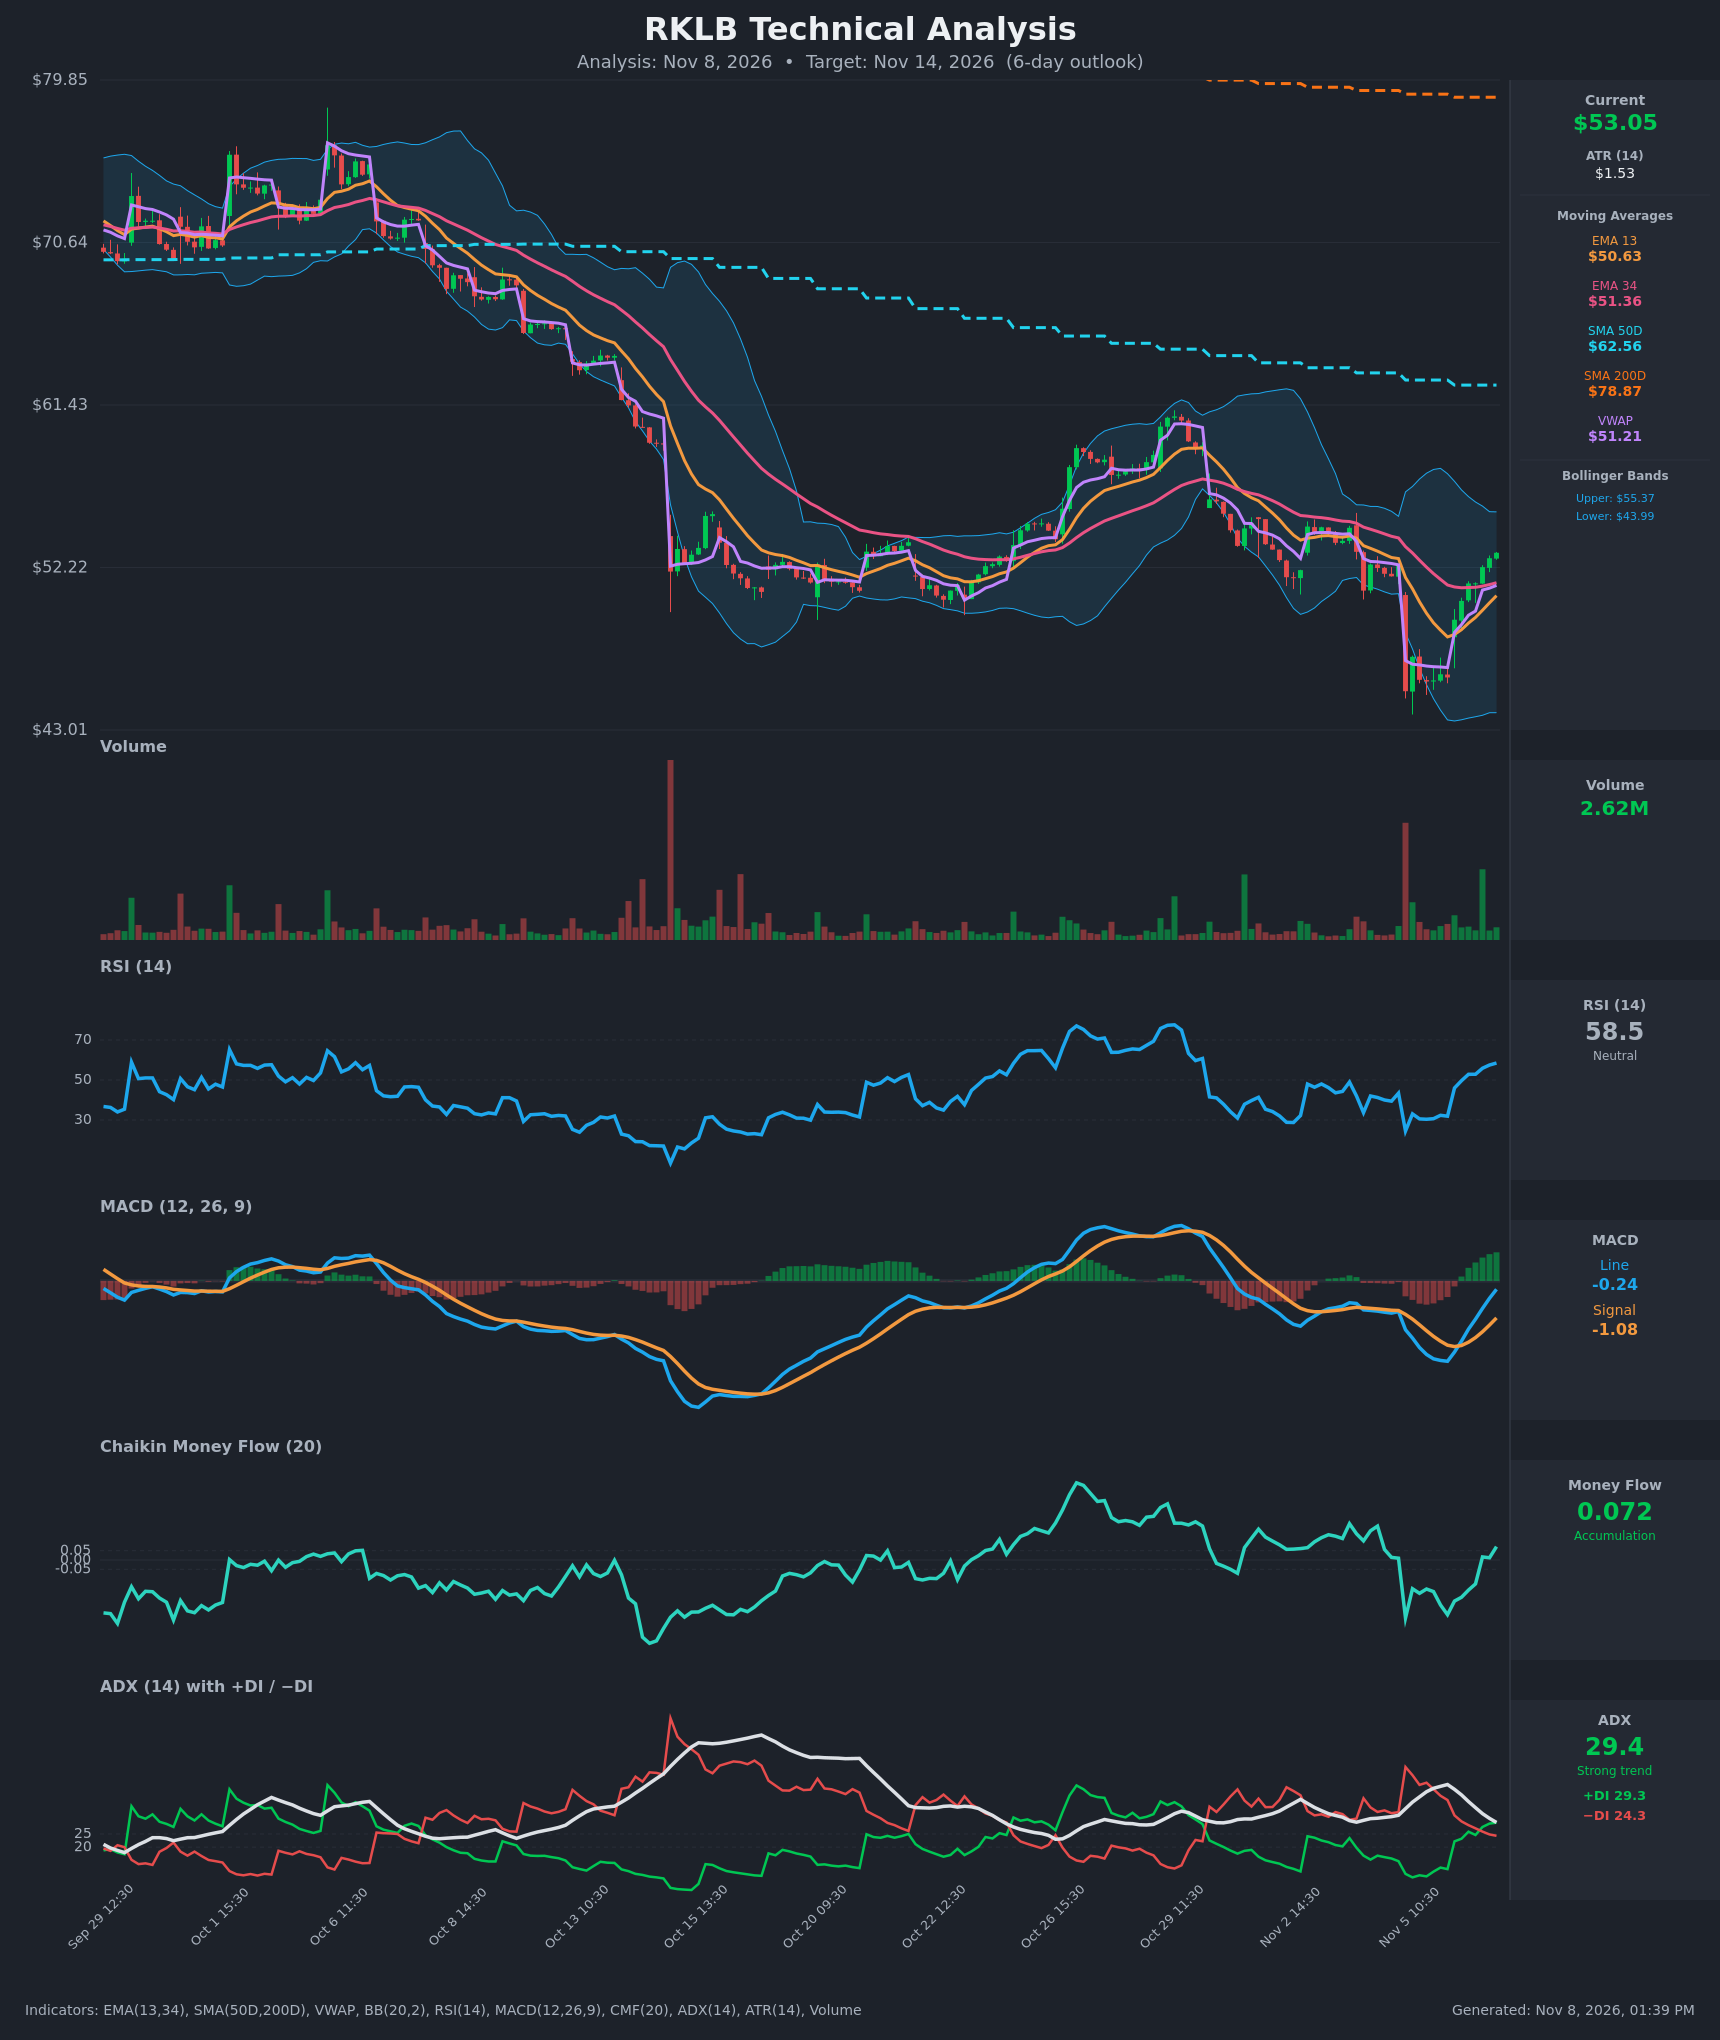
Analysis
TECHNICAL INDICATORS
- RSI (14): 58.49, up from about 24.5 on the Nov 5 open and 46 on the Nov 6 open. Momentum is rising and has moved from oversold to the upper half of neutral. There is room before 70. [Bullish]
- 20 EMA: The data provides EMA 13 ($50.63) and EMA 34 ($51.36) instead. Price at $53.06 is above both, so they act as support. EMA 13 has been rising since Nov 5 and is closing in on EMA 34, but there is no bullish crossover yet. [Bullish]
- MACD: Line -0.24 against signal -1.08, with the histogram positive at about +0.83 and rising sharply. The line is still below zero, but a bullish crossover occurred on Nov 6 (-2.07 vs -1.91 → -1.75 vs -1.88). This is a recovery in momentum inside a larger downtrend. [Bullish]
- Bollinger Bands (20): Upper $55.37, lower $43.99, with price at $53.06, in the upper third of the bands. The bands are wide after the Nov 5 flush. The upper band, about $2.3 above, is the near-term ceiling, and the midline is roughly $49.7. [Neutral]
- CMF (20): +0.072, up from -0.31 on Nov 5 and just crossing into accumulation above +0.05. This is an early, fresh signal that buyers are absorbing the dip. [Accumulation]
- ADX (14): 29.4 and falling from about 43.7. +DI (29.3) has just crossed above −DI (24.3). The trend is still strong, but it is the bearish trend that is exhausting, and the DI crossover favors bulls. [Strong Trend, turning Bullish]
- Volume: 2.62M on the latest bar, in line with normal volume. The recovery bars are mostly green, while the large red-volume spike was on the Nov 5 gap down. There was no capitulation-sized volume on the bounce, so the rebound is modestly supported. [Mildly Bullish]
Longer-term context: price is below SMA50D ($62.56) and SMA200D ($78.87), and the SMA50 is far below the SMA200 (death cross in place). The long-term trend is clearly down, which caps how far a bounce can reasonably run. VWAP ($51.21) is below price, which is supportive.
DIVERGENCES & TRENDS
- No clear price/RSI divergence. RSI made a very low reading (about 24.5) on the Nov 5 flush, and the rebound has been orderly.
- The MACD bullish crossover (Nov 6), the +DI/−DI crossover (Nov 6, 14:30–15:30) and CMF moving back above +0.05 are all fresh and agree with each other.
- Price has reclaimed EMA13, EMA34 and VWAP and has filled the gap from the Nov 4 close ($52.38).
- The larger structure is a series of lower highs ($77 → $71 → $61), with price still far below the SMA50/200. This is a counter-trend relief rally and the main bearish caveat.
- ADX is rolling over from an extreme (43+), which means selling momentum is fading.
CHART PATTERNS
- No pattern from the reference diagram is clean. The action since Nov 5 looks like a V-shaped recovery from a capitulation low near $45, resembling the Bullish Double Bottom idea loosely, with the Oct 22 low near $49–50 as a higher low area. It is not confirmed.
- The larger picture since late October is a series of lower highs, similar to a Descending Triangle or bearish continuation structure. The $54–55 zone is the prior breakdown/consolidation area and should act as resistance.
- Measured implication: a clean break above $55.4 (upper BB) could open $57–58 (the Oct 29–30 breakdown area), while failure at $54–55 would turn this into a lower high.
POTENTIAL SCENARIOS
- Scenario 1: Bullish Relief-Rally Extension — Momentum indicators (MACD, DI, CMF) continue to build, and price grinds up toward the upper Bollinger Band and the prior breakdown zone. Trigger: hold above $52.00 and a push through $54.50. Target: $54.50–$55.50, with an extension to about $57 on a strong break. Invalidation: a daily close below $51.20 (EMA34/VWAP). (50% probability)
- Scenario 2: Bearish Rejection at Resistance — The bounce stalls at the $54.5–55.4 resistance (upper BB, prior supply, below the falling SMA50), and sellers resume in the larger downtrend. Trigger: rejection at $55 with a loss of $51.30. Target: $50.50, then $48.50 (EMA13 area and below). Invalidation: a close above $55.50. (30% probability)
- Scenario 3: Neutral Consolidation — Price digests the 8-point rally between the EMAs and the upper band. Trigger: ADX continuing to fall with price pinned between $51.5 and $54.5. Target: about $53. Invalidation: a break outside $51.0–$55.4. (20% probability)
PRICE TARGETS
- Target Price: $54.40 (6-day, Nov 14 close)
- Expected Range: $51.00 to $55.40, a width of $4.40, which is about 8.3% of the current price. That is consistent with roughly 1.5–2× ATR-scaled 6-day volatility and sits between the 2–3 day and 7–10 day guidance.
- Key Levels: Support at $51.30 (EMA34/VWAP cluster), Resistance at $55.37 (upper Bollinger Band; the $54.5–55.5 prior supply zone sits just below)
OVERALL BIAS
OVERALL BIAS: BULLISH - Short-term momentum has turned decisively up: a MACD bullish crossover, +DI over −DI, CMF in accumulation, and price above EMA13, EMA34 and VWAP with RSI rising from oversold. Upside is likely capped near $55–56 by the upper Bollinger Band and the prior breakdown zone, and by the long-term downtrend below SMA50/200.
This is educational analysis and not financial advice.