DELL 13-day bearish forecast — Nov 8, 2026
- Bias: Bearish
- Timeframe: 13 days (made Nov 8, 2026, target date Nov 20, 2026)
- Price at analysis: $328.58
- Price target: $320.00
- Expected range: $302.00 – $336.00
- Result: Pending — graded after the close on Nov 20, 2026
Get a free AI analysis of DELL today
Analysis
TECHNICAL INDICATORS
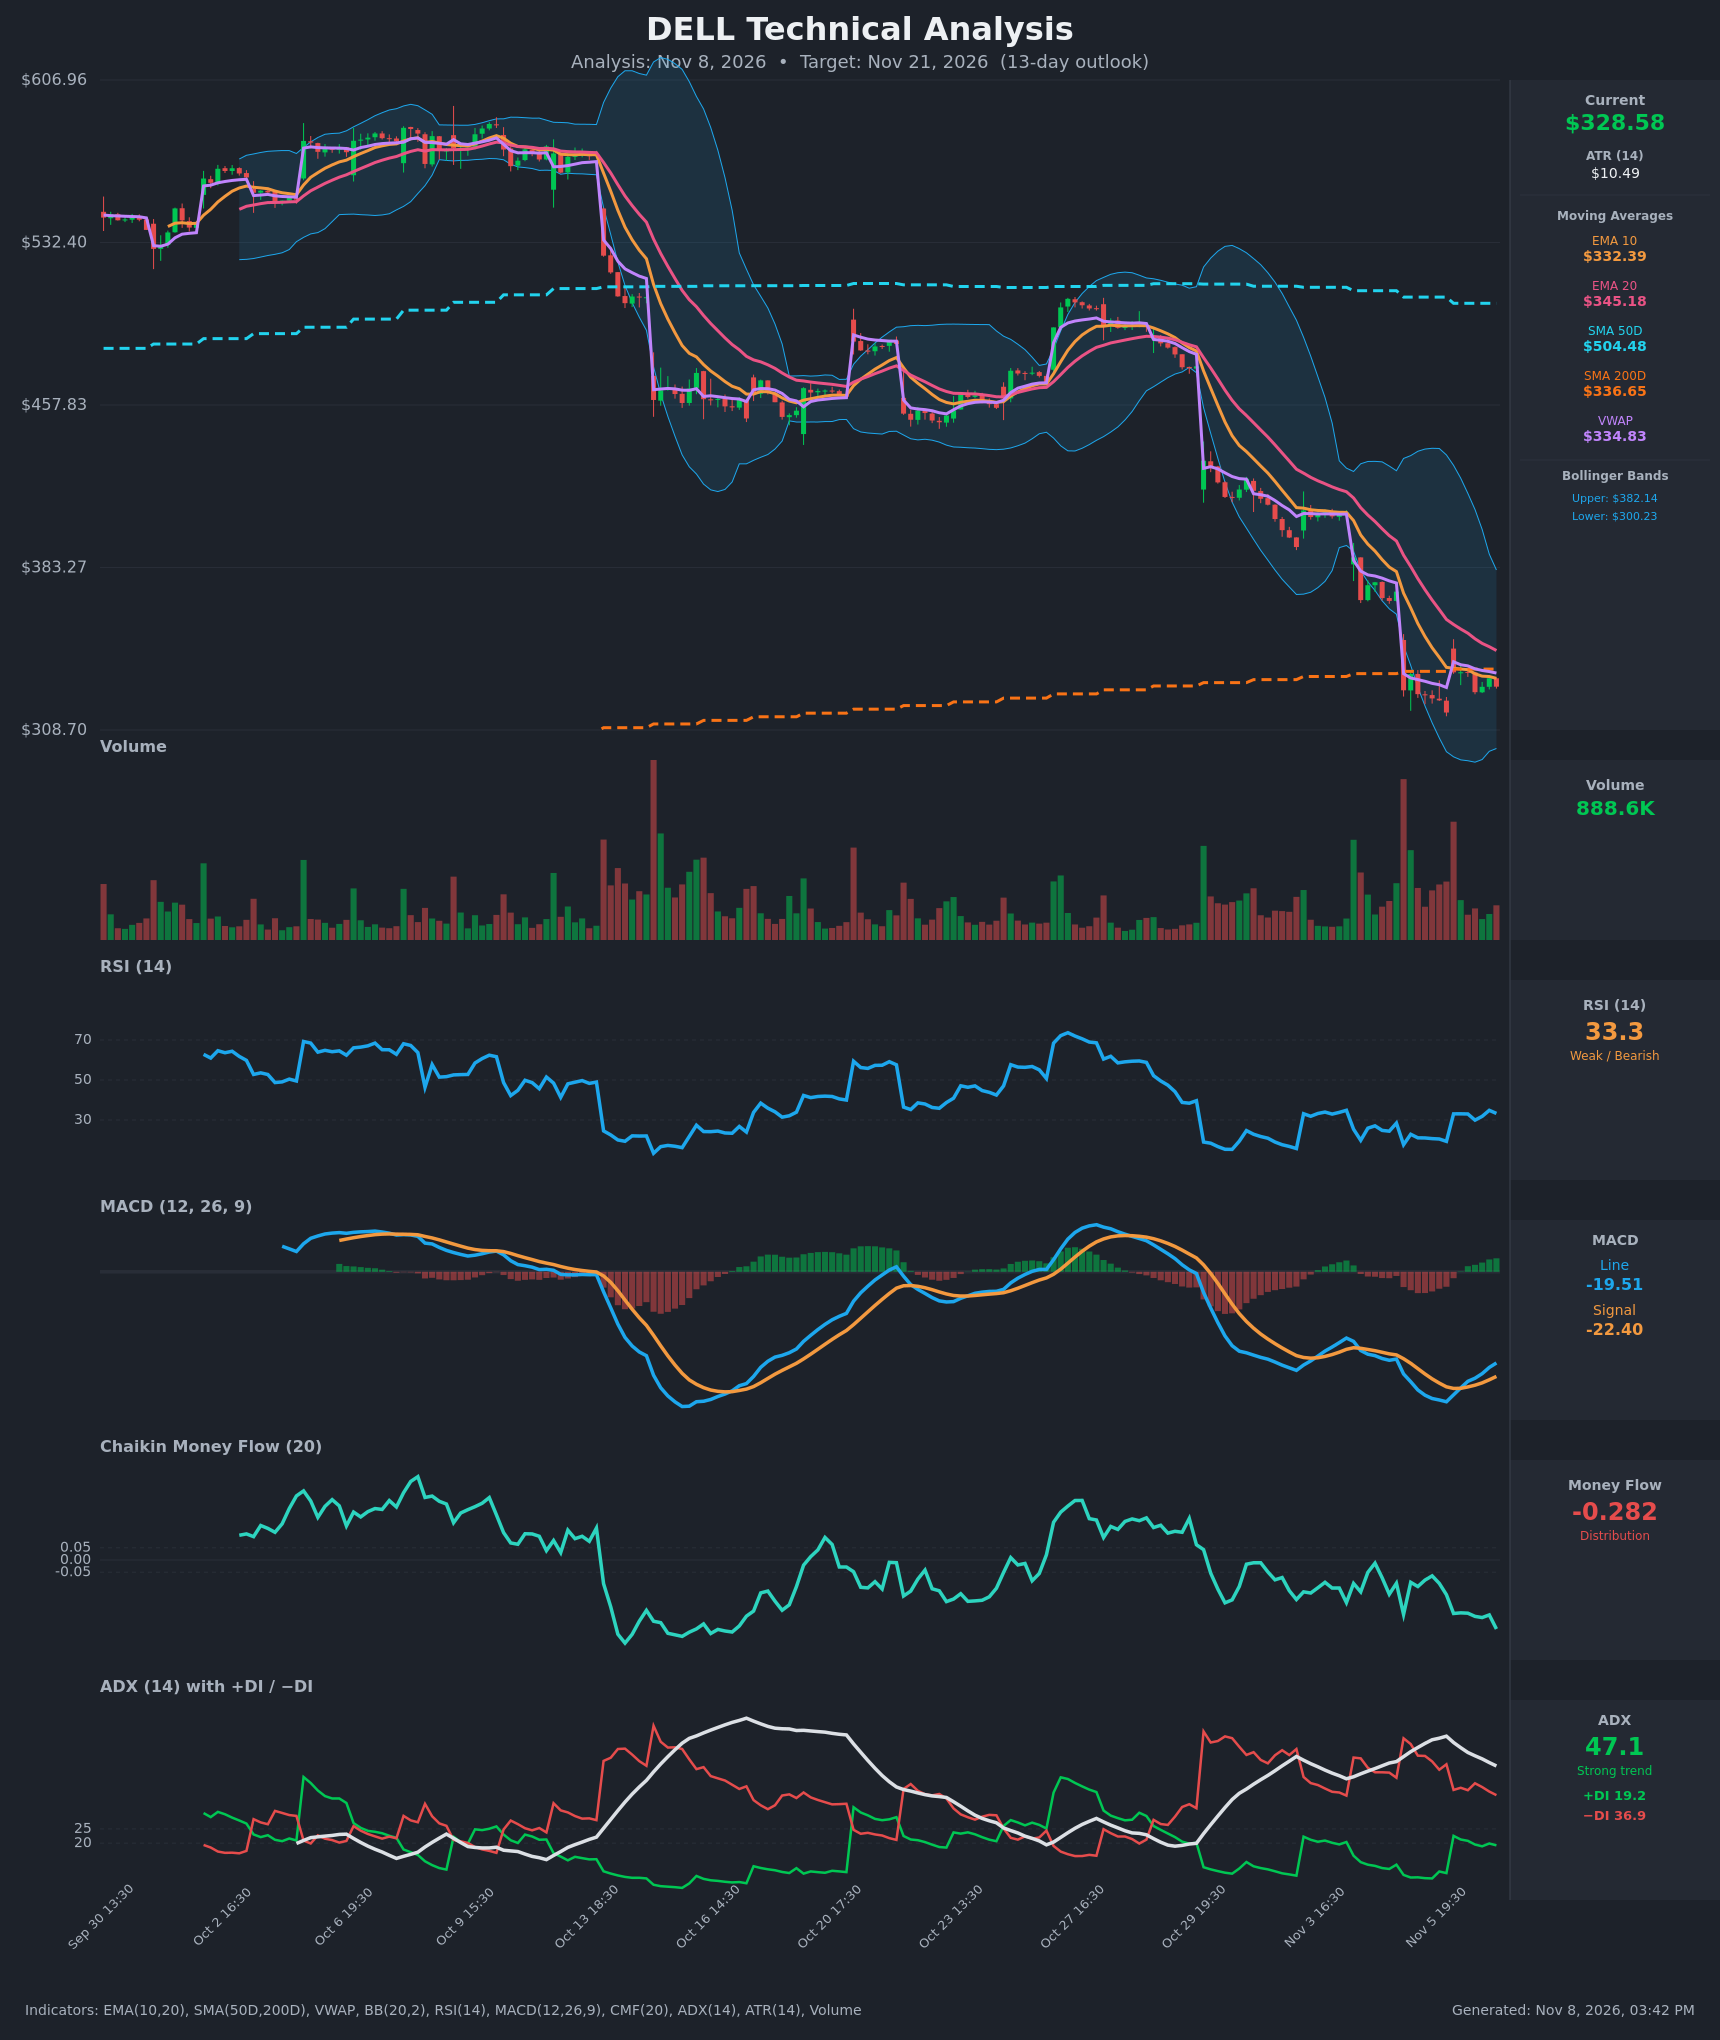
- RSI (14): 33.28, just above oversold. It bounced from 17-21 on Nov 5 to the low 30s and has stalled there. It is still in bearish territory, but the oversold washout has eased. [Bearish]
- 20 EMA: $345.18, with price ($328.58) below it. The EMA 10 ($332.39) is also above price and sits below the EMA 20, so the bearish stack is intact. Both act as overhead resistance. [Bearish]
- MACD: Line -19.51 vs signal -22.40, so the line is above the signal. The histogram is positive (~+2.9) and rising, a bullish crossover that formed while still deep below zero. This is a relief-bounce signal, not a trend reversal. [Bullish]
- Bollinger Bands (20): Upper $382.14, lower $300.23, mid ≈ $341. Price is in the lower half, about 34% of the band width above the lower band. The bands are very wide after the plunge, and the price has bounced off the lower band without reclaiming the midline. [Bearish]
- CMF (20): -0.282, well below -0.05 and still falling. Distribution is heavy, and the bounce has not drawn in buyers. [Distribution]
- ADX (14): 47.1 and slowly declining from a peak of 57.6. −DI (36.9) is far above +DI (19.2). The trend is very strong and bearish, though fading as the move matures. [Strong Trend – Bearish]
- Volume: 888.6K, modest against the huge spikes during the Nov 3-5 breakdown. The capitulation volume shows a flush, but the bounce is on light volume and lacks conviction. [Neutral to Mildly Bearish]
DIVERGENCES & TRENDS
- Bullish MACD divergence: Price made lower lows on Nov 5 (~$316.7) while the MACD line has risen from -27.8 to -19.5. The MACD crossed above its signal on Nov 6, and the histogram is turning positive.
- RSI: Recovered from 17.7 to the low 30s and is flat. It is a modest bullish divergence, but without a move above 40-50 it is not confirmed.
- CMF and ADX: CMF is still making new lows (-0.282), which conflicts with the MACD bounce and shows money still leaving. ADX is rolling over from an extreme level (57 → 47), which signals trend exhaustion rather than reversal.
- Moving averages: SMA50D ($504) is far above price and the 200D is at $336.65. Price has fallen below the SMA200D, which has turned into resistance. EMA10 is converging on price, and the EMA10/EMA20 gap is narrowing but has not crossed.
- VWAP: $334.83, just above price, acting as resistance.
CHART PATTERNS
- No clean pattern from the reference diagram has completed. The decline from ~$570 to ~$317 looks like a bearish continuation structure, a stair-step of gaps lower with small consolidations (similar to a Bearish Flag/Pennant), and the small range at $316-$335 is the latest consolidation.
- A Bullish Falling Wedge is possible given price hugging the lower Bollinger Band and the MACD divergence, but the structure is not mature enough to confirm.
- Key breakdown level is ~$316.7 (Nov 5 low). A measured move from a flag/pennant breakdown would point toward ~$295-$300. A reclaim of $345 (EMA20/mid-band) would negate the bearish read.
POTENTIAL SCENARIOS
- Scenario 1: Bearish Continuation Lower — Price fails at the SMA200D/VWAP/EMA10 cluster ($332-$337), CMF stays deeply negative and −DI stays dominant, so the pause resolves lower. Trigger: Close below $316.7. Target: $300-$305 (lower band), extension to ~$295. Invalidation: Daily close above $345. (50% probability)
- Scenario 2: Bullish Relief Bounce — The MACD bullish crossover and oversold RSI drive a mean-reversion rally toward the middle band after the capitulation flush. Trigger: Break above $337 on rising volume. Target: $345-$355. Invalidation: Close below $316. (35% probability)
- Scenario 3: Neutral Choppy Consolidation — Price ranges between $316 and $340 as ADX fades. Trigger: Failure to break either side. Target: $325-$335. Invalidation: Move outside $312-$345. (15% probability)
PRICE TARGETS
For a 13-day timeframe (14-21 day guidance of ~8-12%, scaled slightly lower), the range width is ~$33, about 10% of the current price. ATR of $10.49 supports this: roughly 3 ATR over 13 days.
- Target Price: $320.00 (for 13 days out)
- Expected Range: $302.00 to $336.00 (width $34 ≈ 10.3%)
- Key Levels: Support at $316.70, Resistance at $337.00
OVERALL BIAS
OVERALL BIAS: BEARISH - Price is below all key moving averages, including the 200D SMA, with −DI far above +DI and CMF at -0.28 showing persistent distribution. The MACD crossover and RSI recovery point to a relief bounce, but it is likely to meet resistance at $332-$345 before another leg down toward the lower band.
This is educational analysis and not financial advice.