F 13-day bearish forecast — Nov 8, 2026
- Bias: Bearish
- Timeframe: 13 days (made Nov 8, 2026, target date Nov 20, 2026)
- Price at analysis: $12.45
- Price target: $12.30
- Expected range: $11.95 – $12.85
- Result: Pending — graded after the close on Nov 20, 2026
Get a free AI analysis of F today
Analysis
TECHNICAL INDICATORS
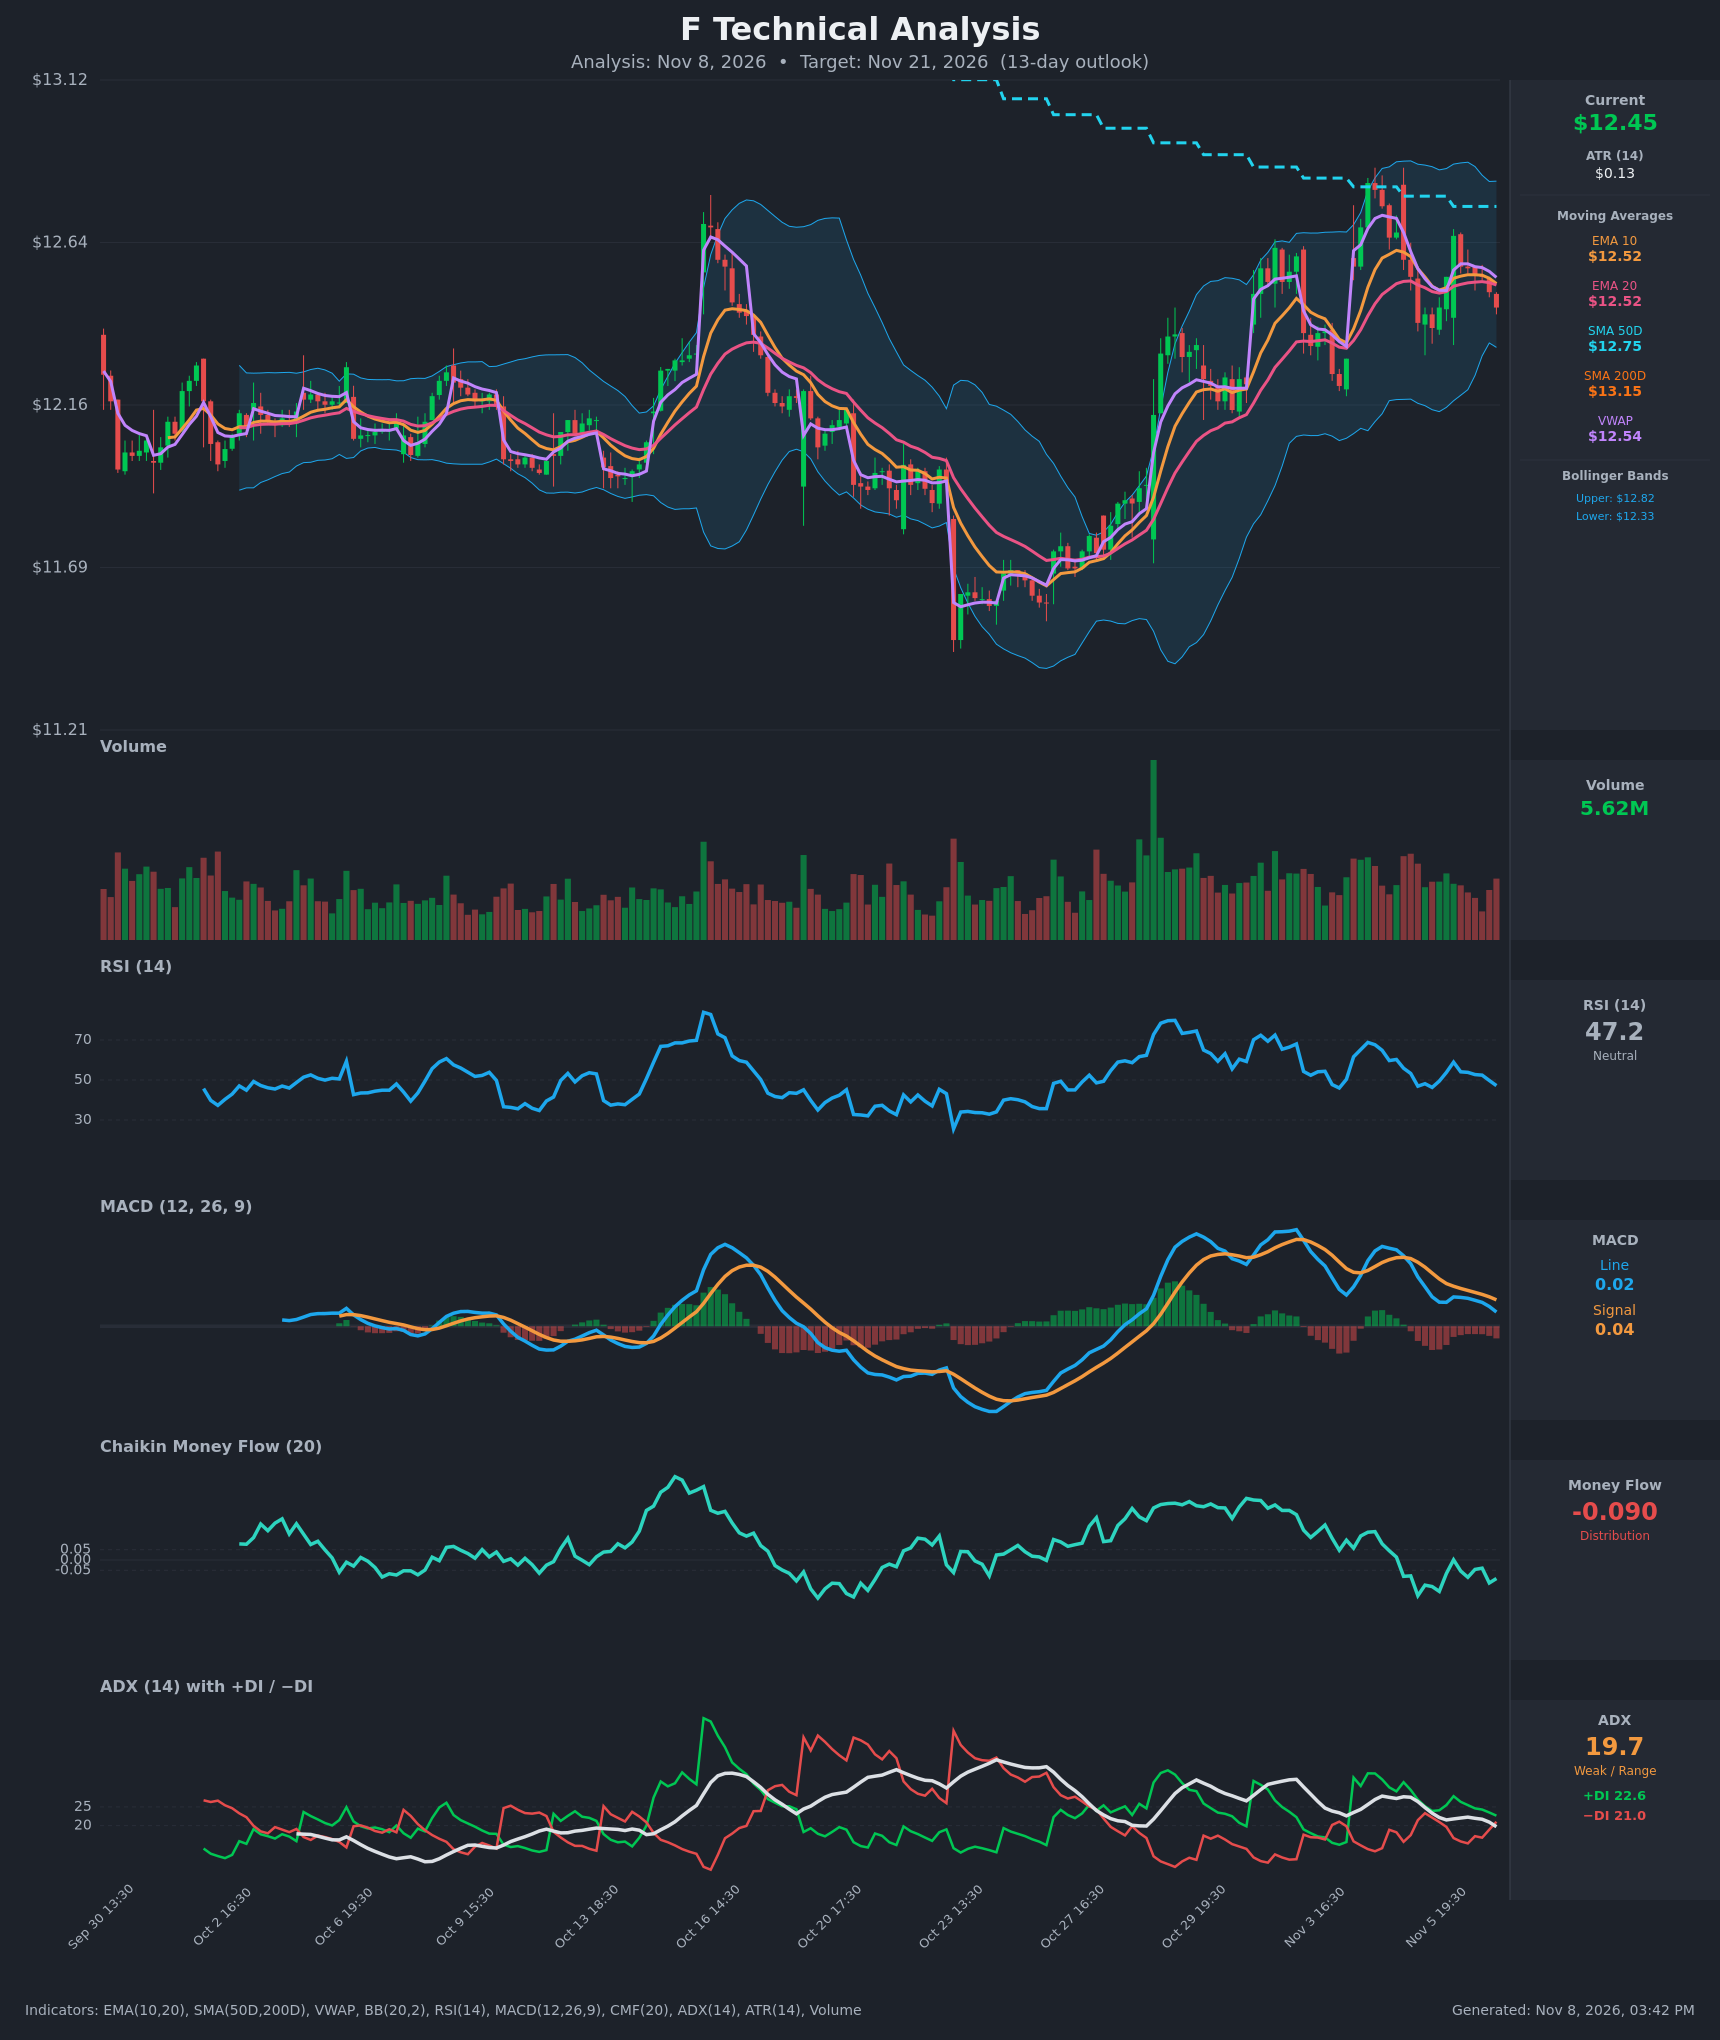
- RSI (14): 47.19, just below the 50 midline. It has fallen from 60.3 on Nov 4 and is making lower highs (59 → 54 → 47). Momentum is fading but not oversold. [Neutral]
- 20 EMA: $12.5161. Price ($12.45) is below both the 20 EMA and the 10 EMA ($12.5202). EMA10 has rolled over to meet EMA20, so the EMAs are flat and converging. The EMA zone around $12.52 is now overhead resistance. [Bearish]
- MACD: Line 0.0236 is below Signal 0.0439, a bearish crossover that began around Nov 5. The histogram is negative and the line is still declining. The line is still slightly above zero, so the damage is mild. [Bearish]
- Bollinger Bands (20): Upper $12.8206, lower $12.3331, mid-band about $12.58. Price is in the lower third, below the mid-band, with the bands relatively narrow. A test of the lower band at $12.33 is likely. [Bearish]
- CMF (20): -0.090, below the -0.05 threshold and sustained negative over the last 15 bars (as low as -0.173). Money flow has deteriorated from strongly positive in late October, which signals distribution. [Distribution]
- ADX (14): 19.7, falling from 27.7, so the trend is weak and range-bound. +DI is 22.6 versus −DI 21.0. Bulls are barely on top, and −DI has been rising while +DI falls, so a bearish DI crossover is close. [Weak Trend, slightly bullish but deteriorating]
- Volume: 5.62M, roughly average, with no surge on the recent pullback. Red bars have slightly outweighed green ones in the last few sessions. There is no capitulation and no strong conviction either way. [Neutral to mildly bearish]
Moving average context: price is below VWAP ($12.5384), below SMA50 ($12.7464) and below SMA200 ($13.1468). SMA50 is also below SMA200, so the long-term structure is a downtrend with no golden cross.
DIVERGENCES & TRENDS
- Price made a higher swing high around $12.8 on Nov 3-4, but RSI, MACD and CMF all made lower highs. The late-October rally was stronger than the recent bounce.
- MACD crossed below its signal line and the histogram turned negative. The line is trending toward zero.
- CMF has fallen from about +0.15 in late October to -0.09 while price held near its highs. This is a bearish divergence between price and money flow.
- ADX has dropped from the high 20s to 19.7 and the DI spread has collapsed from +14 to +1.6. The Nov 3-4 uptrend has stalled.
- The EMA10/EMA20 gap has closed to almost nothing. A bearish EMA cross would be a further short-term negative.
- Price is below the descending SMA50 and the SMA200 (dashed cyan line), which keep capping rallies.
CHART PATTERNS
- Loose Bearish Double Top / range: Price has tested the $12.65-$12.80 zone repeatedly (Nov 3-4, Nov 6) and failed. The "neckline" is around $12.35-$12.40 (the recent lows and the lower Bollinger Band). A close below it would project roughly $0.30-$0.40 lower, to about $12.00-$12.10.
- Lower highs / mild descending triangle tendency: Highs are slowly falling while $12.35-$12.40 acts as flat support. This leans bearish, but the structure is unclear, so confidence is modest.
- The prior rally from about $11.50 to $12.80 could be read as a pole, with the pullback a bullish flag. However, CMF, MACD and the MAs do not support that reading, and a flag would need a breakout above about $12.70 to confirm.
POTENTIAL SCENARIOS
- Scenario 1: Bearish Breakdown Below Range Support — Distribution (CMF -0.09), bearish MACD and rejection at the EMA/VWAP cluster push price through the lower Bollinger Band. Trigger: close below $12.33. Target: $12.10-$12.30, with an extension to $11.95. Invalidation: daily close above $12.75 (SMA50). (50% probability)
- Scenario 2: Neutral Range Chop — ADX stays below 20 and price oscillates between $12.33 and $12.65 with no resolution. Trigger: holds above $12.33 and fails at $12.55-$12.60. Target: $12.40-$12.55. Invalidation: close outside $12.30-$12.75. (25% probability)
- Scenario 3: Bullish Reclaim and Flag Breakout — Buyers defend the lower band, price reclaims the EMAs and VWAP, then retests the Nov 4 highs. Trigger: close above $12.55 and then $12.70. Target: $12.80-$12.90. Invalidation: close below $12.30. (25% probability)
PRICE TARGETS
Timeframe: 13 days (target date Nov 21, 2026).
- Target Price: $12.30
- Expected Range: $11.95 to $12.85 (width $0.90, about 7.2% of price, consistent with a 13-day horizon; ATR of $0.127 gives roughly ±$0.45 over 13 days)
- Key Levels: Support at $12.20, Resistance at $12.75
OVERALL BIAS
OVERALL BIAS: BEARISH - Price is below the EMAs, VWAP, SMA50 and SMA200. MACD has crossed bearish, CMF shows sustained distribution, and RSI and +DI are fading. The weak ADX limits conviction, so I expect a drift toward the lower Bollinger Band and slightly below, with $12.75 as the invalidation level.
This is educational analysis and not financial advice.