AMD 13-day bearish forecast — Nov 8, 2026
- Bias: Bearish
- Timeframe: 13 days (made Nov 8, 2026, target date Nov 20, 2026)
- Price at analysis: $449.03
- Price target: $437.50
- Expected range: $418.00 – $464.00
- Result: Pending — graded after the close on Nov 20, 2026
Get a free AI analysis of AMD today
Analysis
TECHNICAL INDICATORS
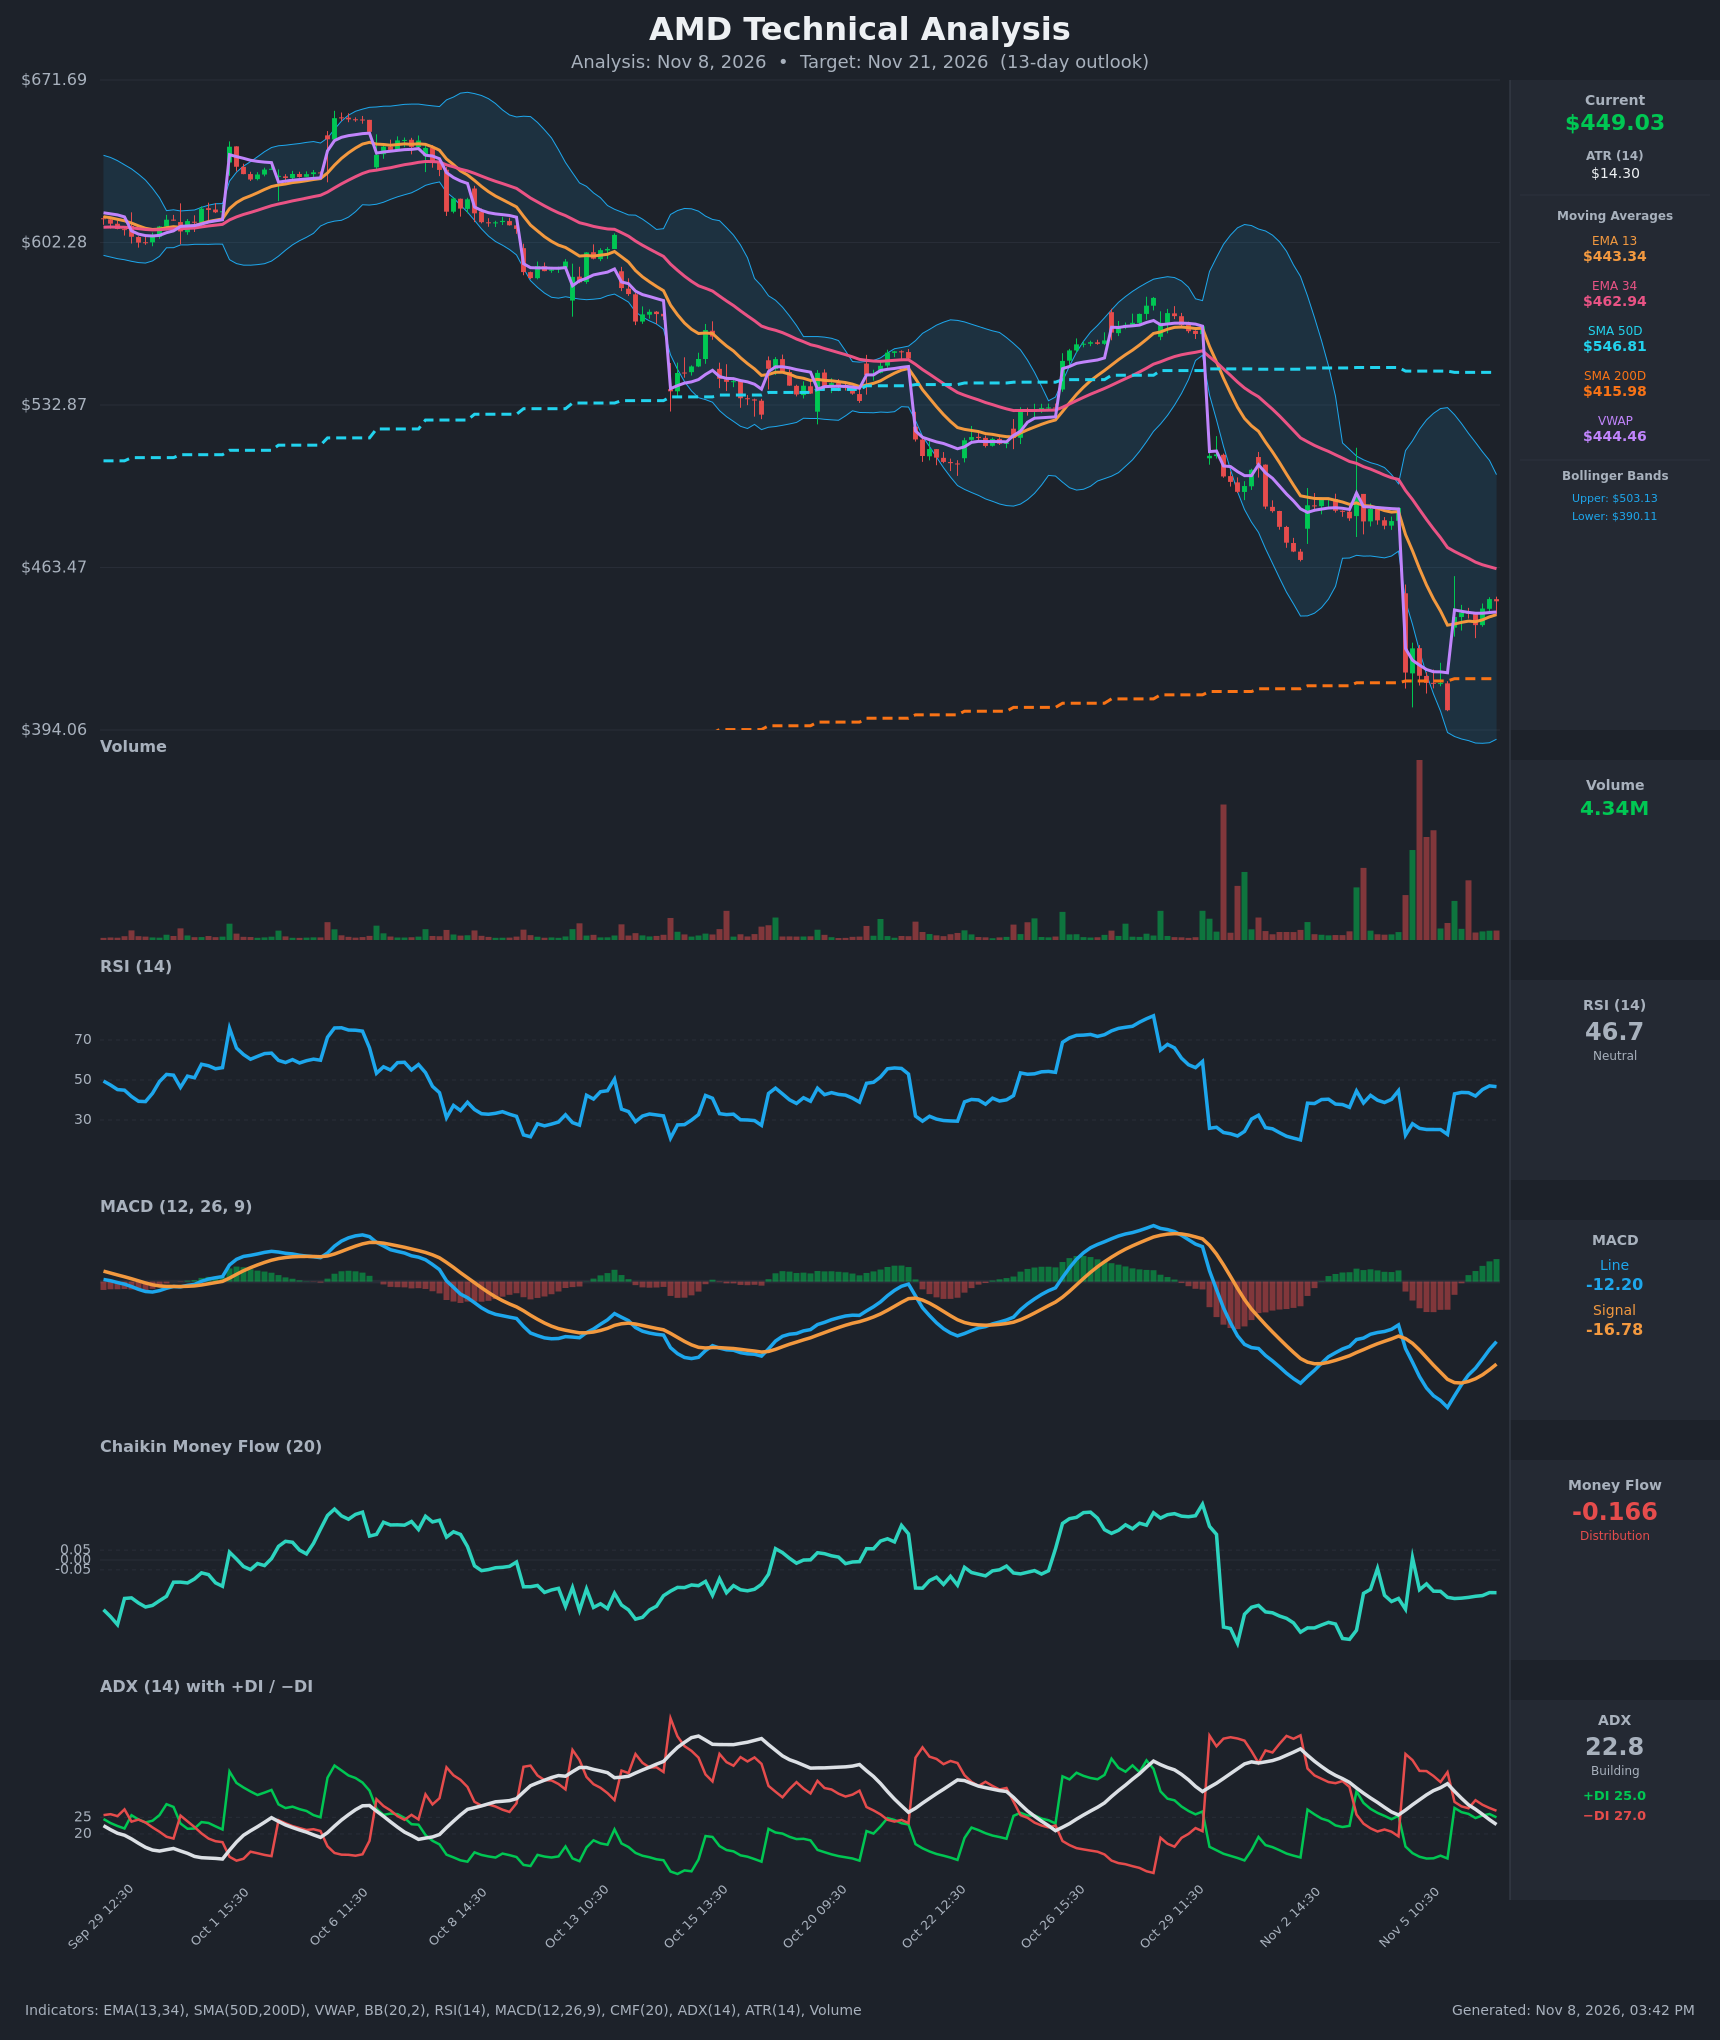
- RSI (14): 46.67, a neutral reading. It has recovered from deeply oversold levels (~22.5-25 on Nov 5) but has stalled below 50, so momentum is repairing without turning bullish. [Neutral]
- 20 EMA: The supplied EMAs are 13/34. EMA13 is $443.34 and price ($449.03) sits just above it, a minor support. EMA34 is $462.94 and sits overhead as resistance. EMA13 is far below EMA34 (a bearish alignment), and the gap is narrowing only slowly. [Bearish]
- MACD: Line -12.20 is above the signal at -16.78, a bullish crossover on Nov 6 around 10:30. The histogram is positive and rising, but everything is still well below zero, so this looks like a relief bounce within a downtrend. [Neutral]
- Bollinger Bands (20): Upper $503.13, lower $390.11, midline ~$446.6. The bands are very wide after the gap-down. Price sits right at the midline, which gives no edge, and the lower band was tagged on Nov 5 (low ~$402). [Neutral]
- CMF (20): -0.166, well below -0.05. It has been negative for almost the whole recent decline, and the bounce has not flipped it. That means distribution, with sellers using the rally to exit. [Distribution]
- ADX (14): 22.8 and falling from 35.2. The trend is losing strength, between range-bound and trending. −DI (27.0) is above +DI (25.0), with the gap narrowing, so bears retain a slim edge. [Weak Trend, Bearish lean]
- Volume: 4.34M on the latest bar, far below the huge spikes on the Nov 5 gap-down. The bounce is on fading volume, which suggests weak buying conviction, and the heavy red bars confirm the earlier panic selling. [Bearish lean / Low-conviction bounce]
DIVERGENCES & TRENDS
- Price made a lower low on Nov 5 (~$402) while MACD is now recovering. That is a short-term momentum improvement rather than a clean divergence.
- The MACD bullish crossover is below zero, which is lower-reliability than one above zero.
- CMF is not confirming the bounce. It stays at -0.166 while price rallied from $402 to $449, which is a bearish divergence in money flow.
- Price is above VWAP ($444.46) and EMA13, a small short-term positive.
- The broader structure is a downtrend of lower highs from ~$650 to ~$450. Price is below SMA50 ($546.81, flat and rolling over). It is still above SMA200 ($415.98), which acts as the key long-term floor.
- No death cross has occurred. SMA50 is still well above SMA200, but the spread is shrinking.
- ADX is falling from its recent high, so the selling impulse is exhausting. That favors consolidation near-term.
CHART PATTERNS
- After the sharp gap-down from ~$489 to ~$418, price is forming a small consolidation of higher lows near $440-450. The closest reference patterns are the Bearish Flag/Pennant, a continuation pattern after a sharp drop. Resolution below ~$438-440 targets $415-402. The measured move of the flagpole is much lower and would break SMA200.
- The larger structure shows a descending sequence of lower highs since October, consistent with a bearish trend channel.
- A Bullish Falling Wedge/Double Bottom is an alternative. The Nov 5 low (~$402-414) was retested around $414 on multiple bars. A close above EMA34 (~$463) would improve that case, with a target near the gap-fill at ~$488.
- Overhead supply sits at $463 (EMA34) and $488 (pre-gap close).
POTENTIAL SCENARIOS
- Scenario 1: Bearish Flag Breakdown — Price fails at the EMA34 / lower-high zone and rolls over as distribution (CMF -0.166) continues and −DI stays on top. Trigger: close below EMA13/VWAP (~$443-444) and then $438. Target: $415-$418 (SMA200 retest), with a stretch to $402-$405. Invalidation: daily close above $463. (47% probability)
- Scenario 2: Bullish Relief Rally — The MACD crossover and RSI recovery extend as shorts cover, and price reclaims EMA34. Trigger: close above $463 on rising volume. Target: $485-$490 (gap fill, upper Bollinger Band area). Invalidation: close below $430. (33% probability)
- Scenario 3: Neutral Range Consolidation — Price chops between the SMA200 floor and EMA34 ceiling as ADX fades below 20. Trigger: ADX < 20 with price holding $430-$460. Target: ~$440-$450. Invalidation: close outside $415-$465. (20% probability)
PRICE TARGETS
- Target Price: $437.50 (13-day outlook)
- Expected Range: $418.00 to $464.00 (width $46 ≈ 10.2% of current price, consistent with the 13-day guidance of ~8-12%)
- Key Levels: Support at $415.98 (SMA200), Resistance at $462.94 (EMA34)
OVERALL BIAS
OVERALL BIAS: BEARISH - Persistent distribution (CMF -0.166), −DI above +DI, price below EMA34 and SMA50, and a low-volume bounce into overhead resistance suggest a post-gap bear flag. The MACD crossover and the SMA200 floor keep conviction modest and limit downside to ~$416.
This is educational analysis and not financial advice.