AAL 13-day bullish forecast — Nov 8, 2026
- Bias: Bullish
- Timeframe: 13 days (made Nov 8, 2026, target date Nov 20, 2026)
- Price at analysis: $13.17
- Price target: $13.40
- Expected range: $12.60 – $13.85
- Result: Pending — graded after the close on Nov 20, 2026
Get a free AI analysis of AAL today
Analysis
TECHNICAL INDICATORS
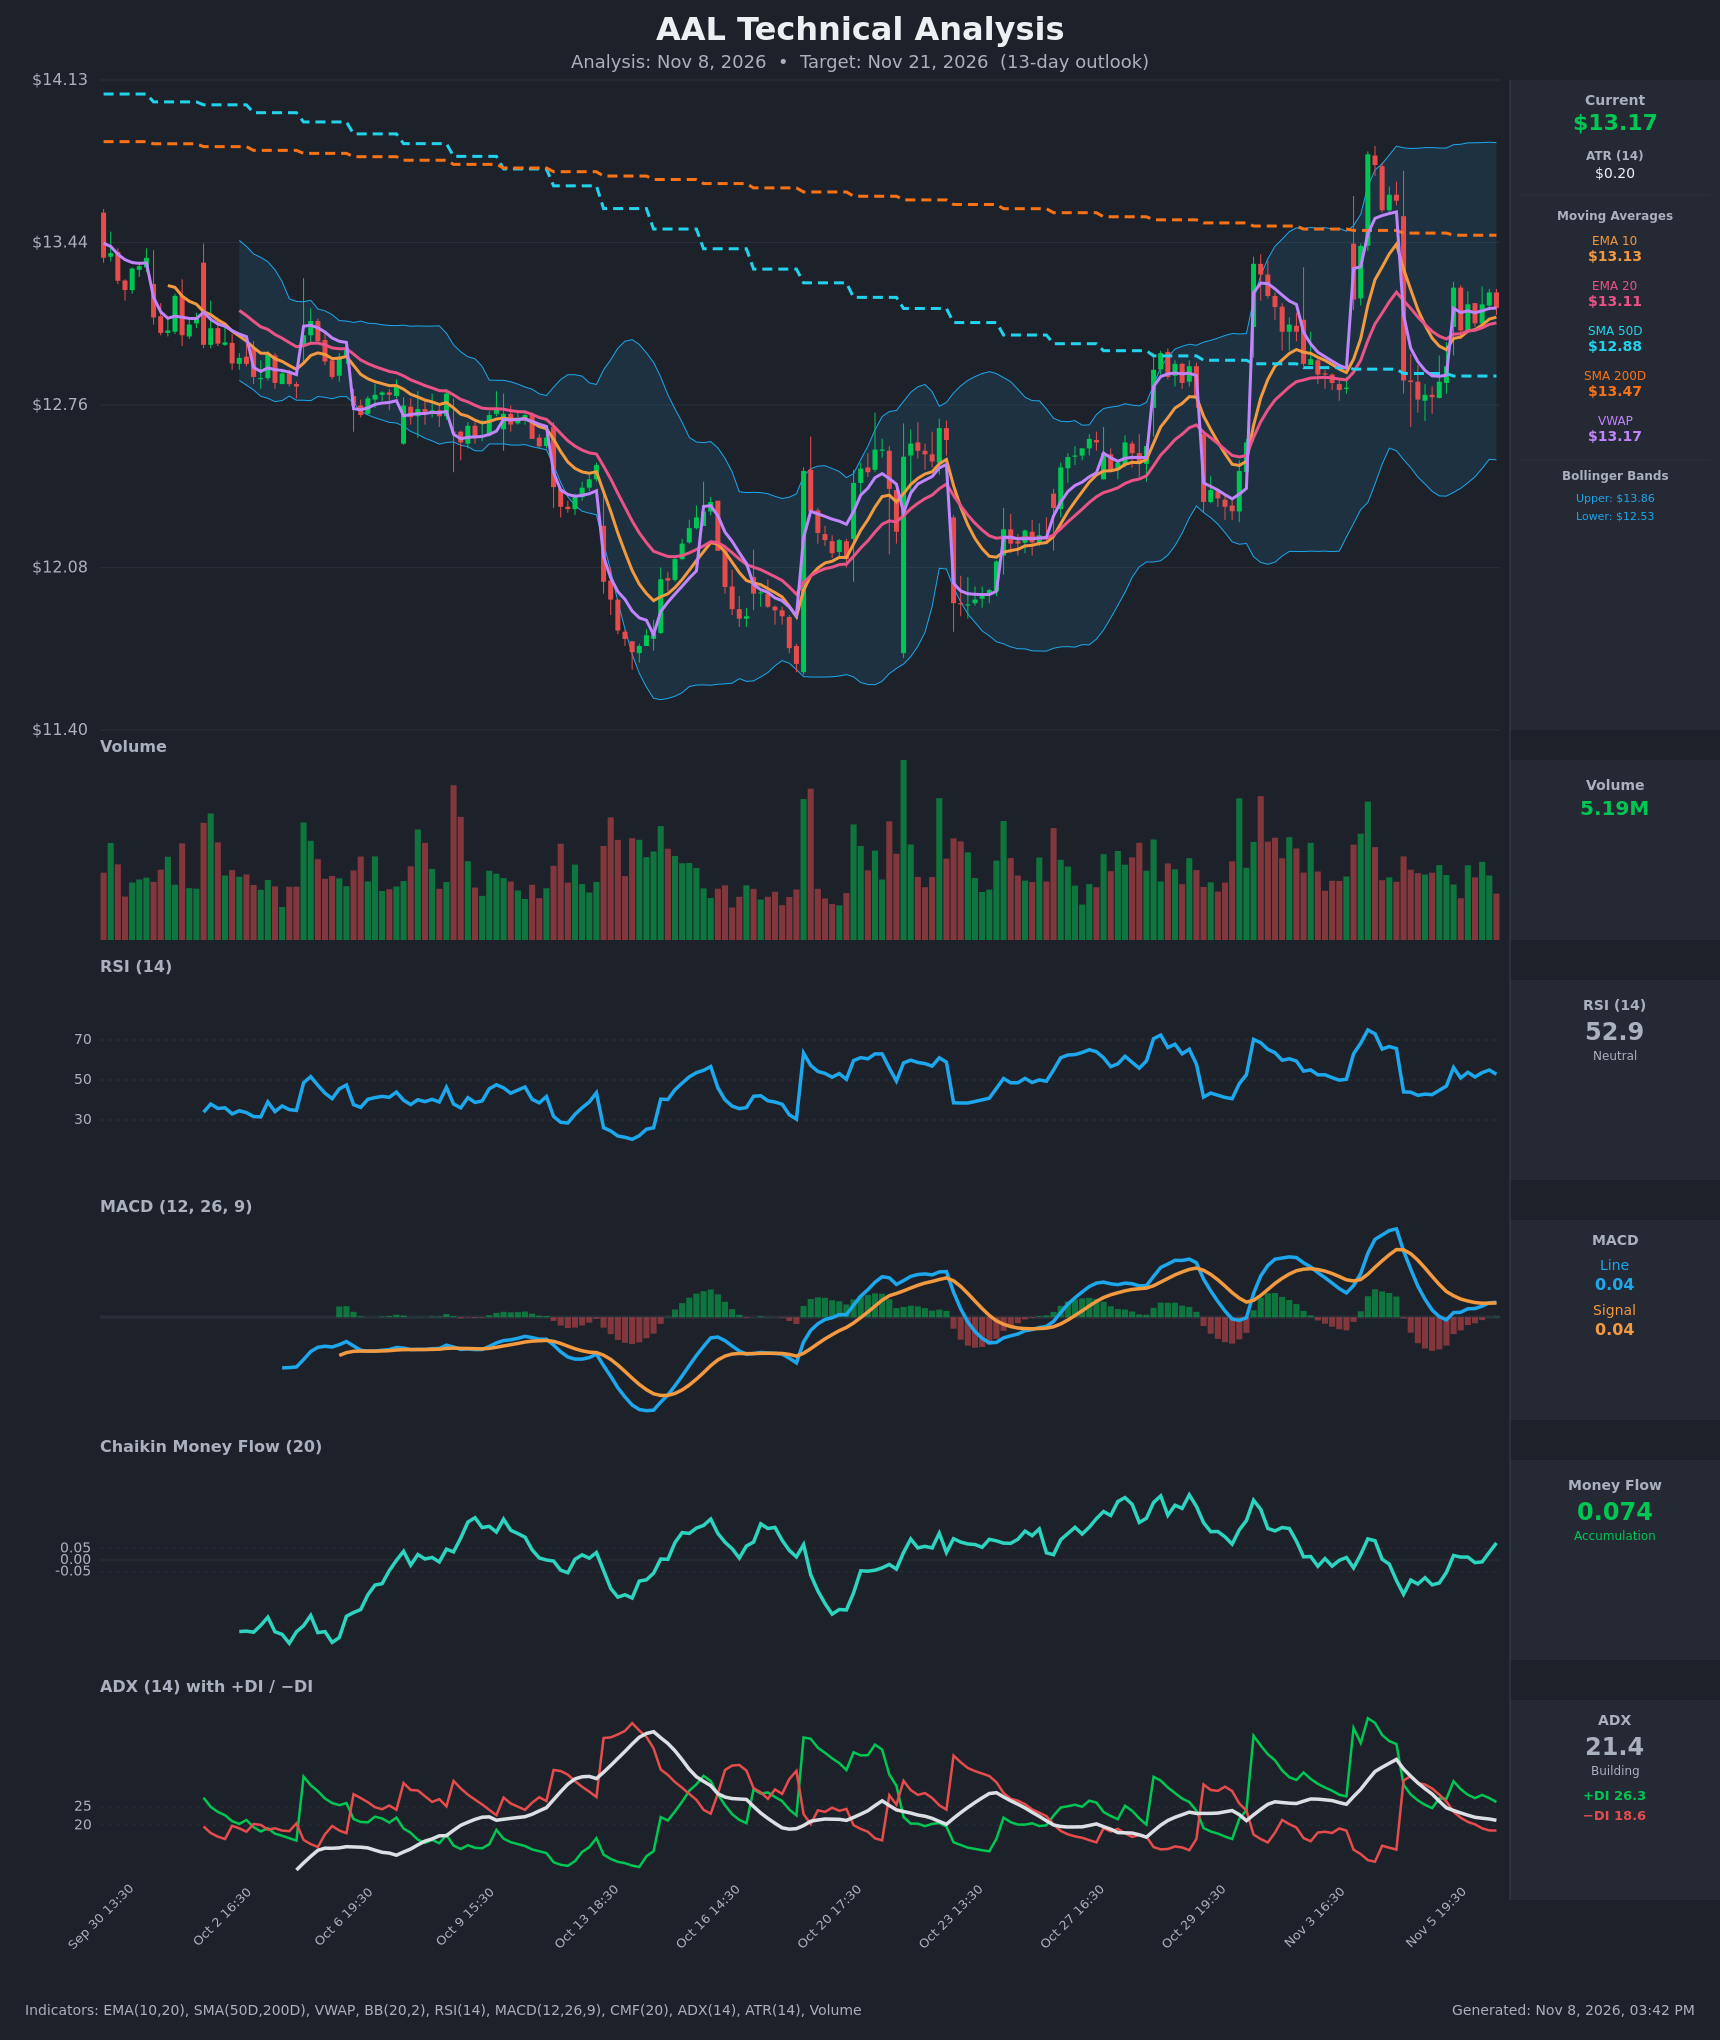
- RSI (14): 52.86, mid-range and recovering from 42-43 on Nov 5 after the sharp gap-down. It has not been overbought since the Nov 3-4 spike (~65-70). Momentum is neutral to mildly positive. [Neutral]
- 20 EMA: $13.1072, with price at $13.17 just above it. EMA10 ($13.13) has crossed back above EMA20 after a brief bearish cross on Nov 5, so the short-term average structure has turned up again. The cushion is thin, about $0.06. [Bullish]
- MACD: Line 0.0400 is just above signal 0.0382, a fresh bullish crossover with a tiny positive histogram. Both lines sit near zero after unwinding the Nov 3-4 peak (0.237), so this is early and low-conviction. [Bullish]
- Bollinger Bands (20): Upper $13.86, lower $12.53, middle about $13.20. Price sits near the midline in a wide band, so volatility is elevated from the spike and gap. There is no squeeze or band-walk, and the midline is acting as a pivot. [Neutral]
- CMF (20): 0.074, above +0.05 and rising from the -0.10 to -0.15 distribution zone on Nov 5. Buying pressure has been returning over the last 4-5 bars. [Accumulation]
- ADX (14): 21.4 and falling from 37.7, so the trend is weak. +DI (26.3) is above −DI (18.6), with the bulls back in control after the DIs crossed on Nov 6. This is a mild bullish tilt inside a low-trend environment. [Weak Trend, Bullish direction]
- Volume: 5.19M, average to slightly below average, with no heavy distribution days since the Nov 5 gap. The recent green bars are modest, so there is no strong confirmation of a breakout either way. [Neutral]
Other moving averages and VWAP:
- Price is above SMA50D ($12.88), above VWAP ($13.17, essentially at it) and below SMA200D ($13.475).
- There is no golden or death cross. SMA50D remains below SMA200D, and the long-term trend is still pressured.
- The flat SMA200D, which has been sloping down since early October, is the key overhead resistance.
DIVERGENCES & TRENDS
- There is no clear price/RSI divergence. Price made higher lows (12.79 → 12.86 → 13.07) while RSI recovered from 42 to 53, which is mildly constructive.
- MACD and the DIs both turned bullish within the last 3-4 bars.
- ADX has dropped from 37.7 to 21.4, so the Nov 3-4 spike and reversal has exhausted and the market is moving toward range behavior.
- CMF has turned back up from negative to positive, which supports the recovery.
- The EMA10/EMA20 cross-down on Nov 5 and re-cross up on Nov 6 suggests a whipsaw, so trend conviction is low.
- On the higher timeframe, price has recovered from the October low near $11.60 and has stayed above the rising SMA50D. It is still capped under the declining SMA200D at $13.475.
CHART PATTERNS
- Bullish Double Bottom / small base: The repeated lows at $12.79-12.80 on Nov 5 and the bounce to $13.26 form a short-term base. A move above $13.26-13.30 would imply a measured move toward the $13.70-13.80 area.
- Ascending Triangle (loose): Higher lows near $12.80 → $13.07 and flat resistance around $13.25 are consistent with this continuation pattern. The pattern is small and imperfect.
- Context caution: The $13.9 spike on Nov 3-4 followed by an immediate reversal looks like a failed breakout. Resistance at SMA200D ($13.475) and the prior spike high near $13.86-13.90 limits the upside.
- Overall, this is a modest bullish base under major resistance, not a high-conviction pattern.
POTENTIAL SCENARIOS
- Scenario 1: Bullish Base Breakout Toward SMA200D — Price holds above the EMAs and SMA50D, builds on the CMF accumulation and +DI dominance, and pushes through the $13.26 swing high up to the SMA200D. Trigger: close above $13.30 with volume above 5.5M. Target: $13.45-$13.70, with an extension to $13.85 if the SMA200D breaks. Invalidation: close below $12.88 (SMA50D). (45% probability)
- Scenario 2: Neutral Range Chop — ADX stays below 20, and price oscillates between roughly $12.85 and $13.45 around the EMAs and VWAP. Trigger: failed breakouts at $13.30 and buyers defending $12.90. Target: $13.05-$13.25. Invalidation: close above $13.50 or below $12.80. (25% probability)
- Scenario 3: Bearish Rejection at SMA200D — The recovery stalls under the SMA200D, the EMA10/EMA20 cross down again, and price retests the Nov 5 lows. Trigger: close below $13.00 and the EMA20, with MACD crossing below signal. Target: $12.75-$12.55 (lower Bollinger Band). Invalidation: close above $13.50. (30% probability)
PRICE TARGETS
- Target Price: $13.40 (13-day, Nov 21, 2026)
- Expected Range: $12.60 to $13.85 (width $1.25, about 9.5% of price, appropriate for a 13-day window)
- Key Levels: Support at $12.88 (SMA50D), with deeper support at $12.79; Resistance at $13.48 (SMA200D), with a further ceiling near $13.86
OVERALL BIAS
OVERALL BIAS: BULLISH - Price is above the EMAs and SMA50D with a fresh MACD bullish crossover, +DI over −DI, and CMF back in accumulation at 0.074. The upside is capped near the SMA200D ($13.475), so conviction is modest.
This is educational analysis and not financial advice.