AMZN 13-day bearish forecast — Nov 8, 2026
- Bias: Bearish
- Timeframe: 13 days (made Nov 8, 2026, target date Nov 20, 2026)
- Price at analysis: $259.35
- Price target: $255.50
- Expected range: $246.50 – $267.50
- Result: Pending — graded after the close on Nov 20, 2026
Get a free AI analysis of AMZN today
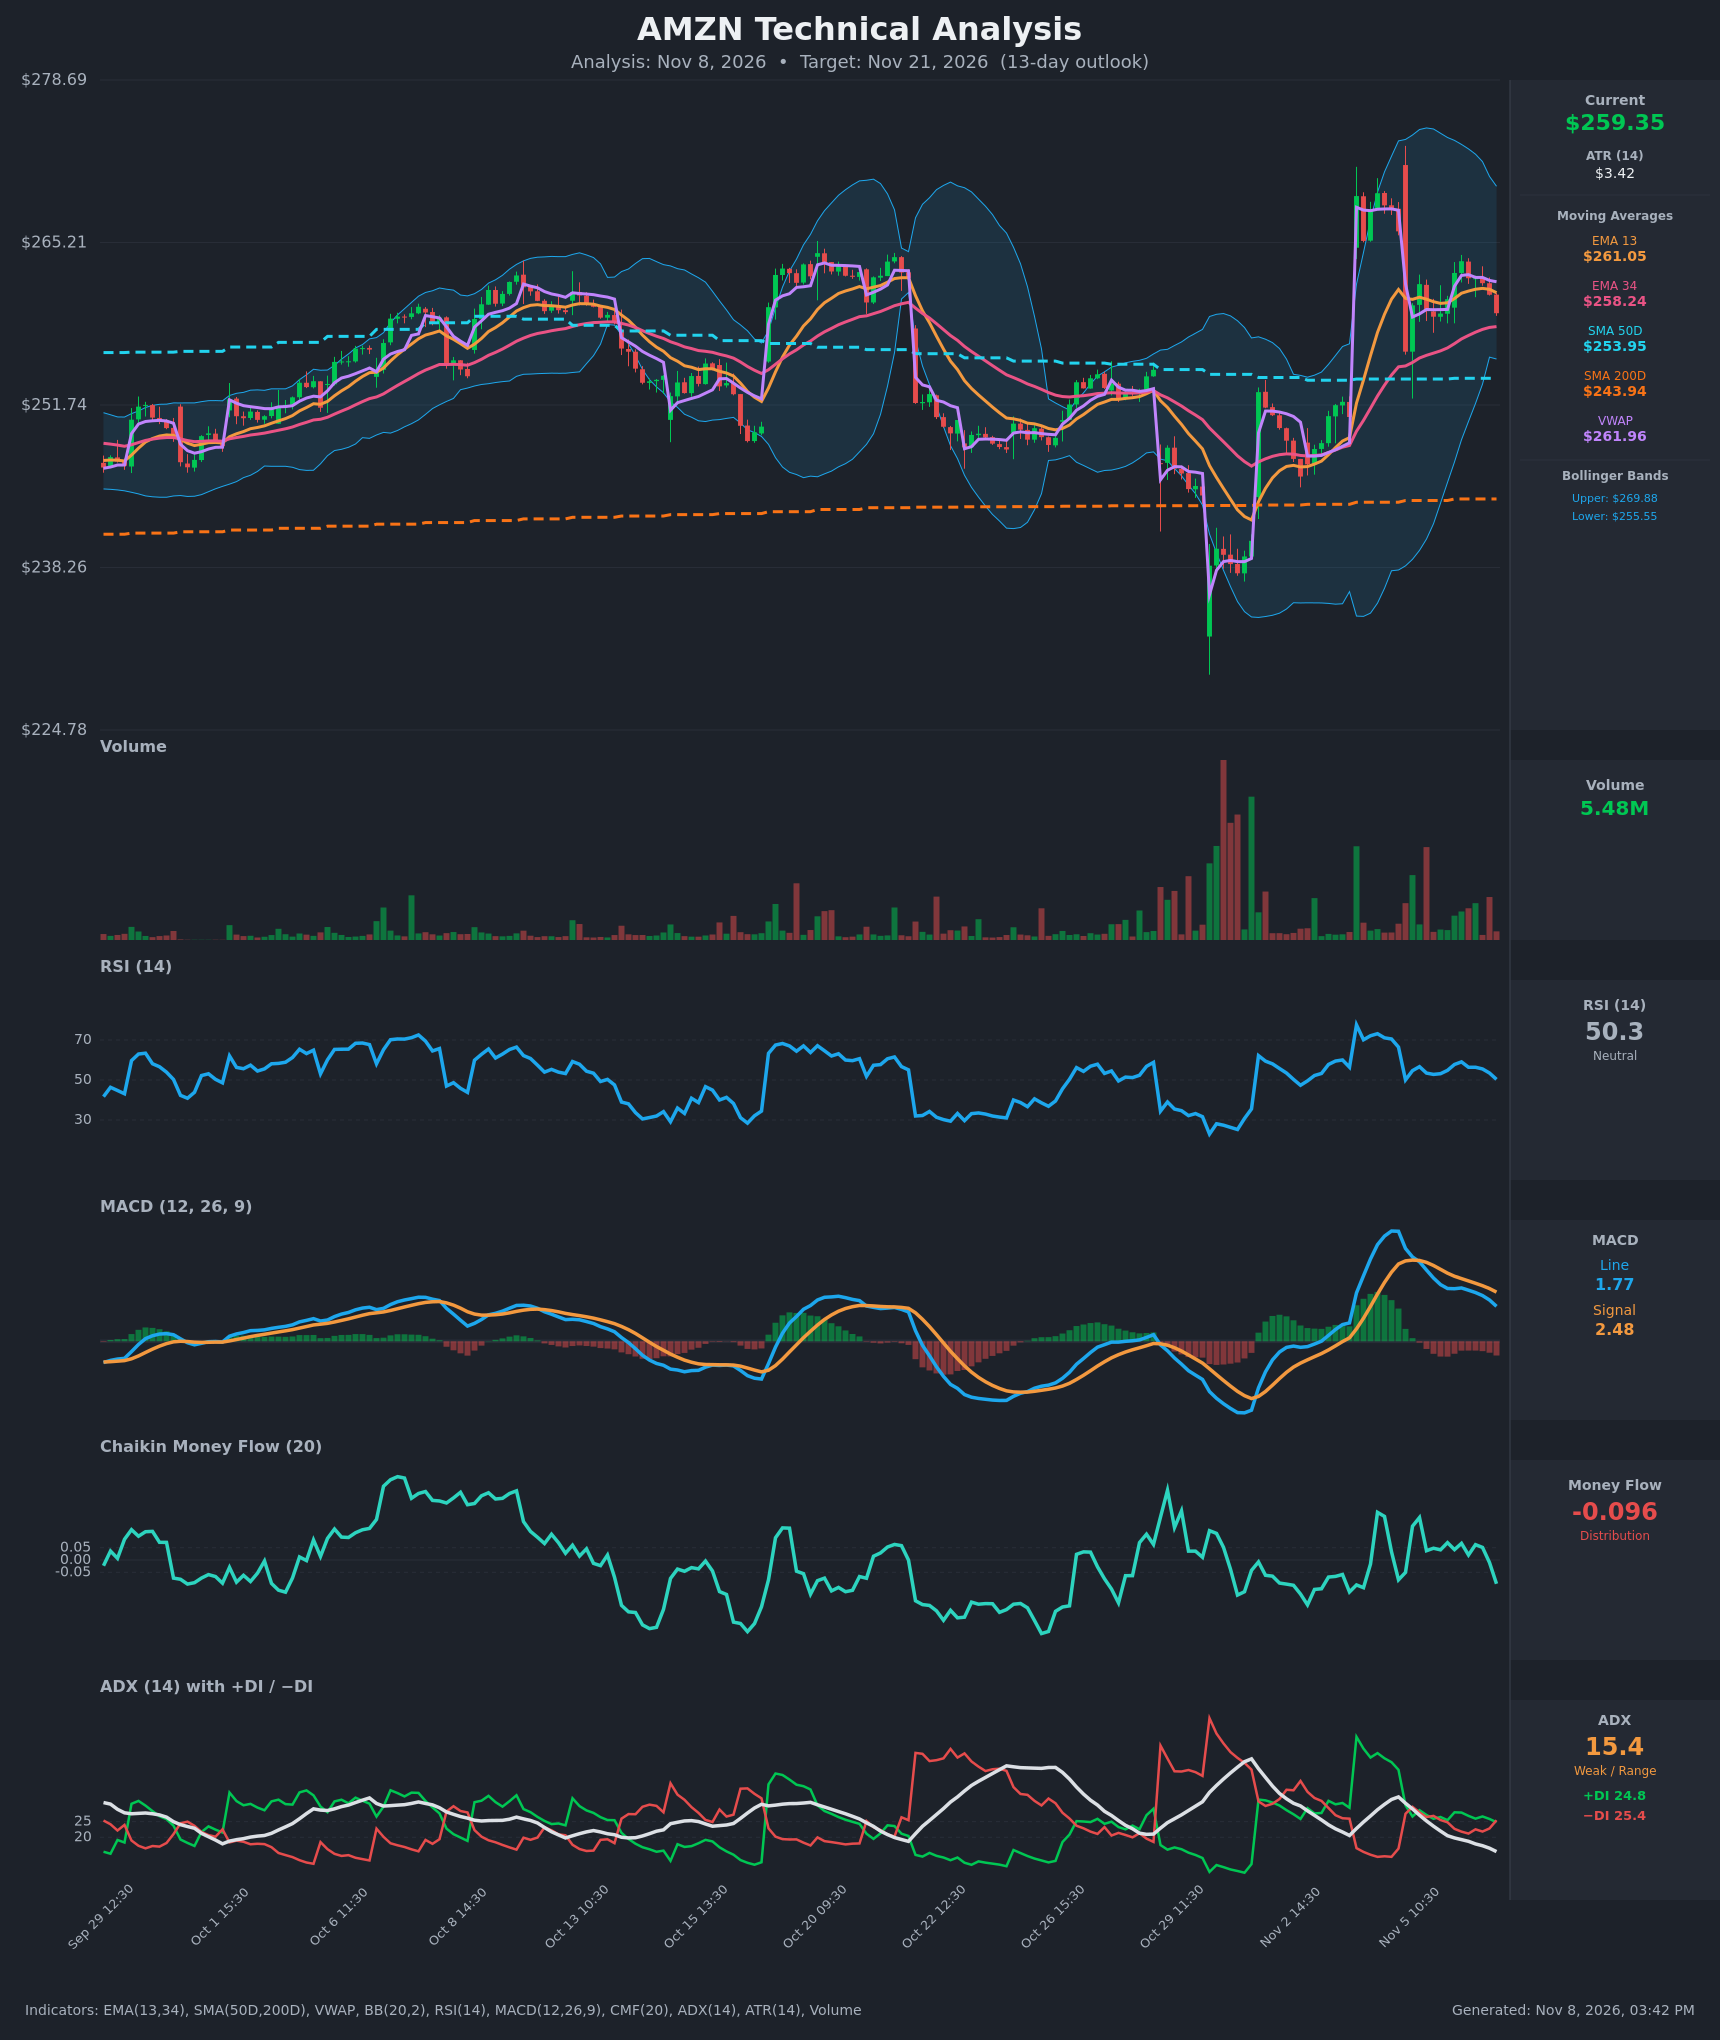
Analysis
TECHNICAL INDICATORS
- RSI (14): 50.32, dead neutral. It has rolled over from about 59 on Nov 6 morning and from the mid-70s spike on Nov 4. Momentum is fading, with no overbought or oversold signal. [Neutral]
- 20 EMA (EMA 13 used as the fast average): EMA 13 is $261.05 and price ($259.35) is below it, so it acts as near-term resistance. Price is still above EMA 34 ($258.24) by only about $1.1, and EMA 13 remains above EMA 34 (no bearish crossover yet, but the gap is narrowing). [Neutral]
- MACD: Line 1.77 is below Signal 2.48, with a negative and widening histogram. The bearish cross occurred on Nov 5 at 13:30, and the line has fallen steadily from 5.56. Momentum is decaying. [Bearish]
- Bollinger Bands (20): Upper $269.88, lower $255.55, so the midline is about $262.7. Price sits below the midline in the lower half of the band, about $3.8 above the lower band. The bands are wide after the Nov 4 volatility spike and have started to contract. [Neutral]
- CMF (20): -0.096, below the -0.05 threshold, and it just rolled over from small positives (+0.17 on Nov 5). That points to fresh distribution. [Distribution]
- ADX (14): 15.4 and falling, so there is no trend (<20). −DI (25.4) has just crossed above +DI (24.8), a marginal bearish tilt with little conviction. [Weak Trend, slight bearish tilt]
- Volume: 5.48M, modest and well below the spike volume of late October. The Nov 6 afternoon decline came on ordinary volume, so there is no panic selling and no strong conviction either way. [Neutral]
Other structure: price is below VWAP ($261.96), which is a mild bearish sign. It is well above SMA50 ($253.95) and SMA200 ($243.94), and SMA50 is above SMA200, so the long-term uptrend is intact with no death cross.
DIVERGENCES & TRENDS
- Price has held roughly $256–$264 since Nov 5, but MACD has dropped from 5.56 to 1.77 and CMF has flipped negative. Momentum and money flow are deteriorating while price is flat, a mild bearish divergence.
- RSI has made lower highs (about 76 → 59) after the Nov 4 spike, which confirms fading upside momentum.
- A bearish MACD signal-line cross (Nov 5) and a fresh −DI over +DI cross are the main recent crossovers. EMA 13/34 and SMA 50/200 have no crossovers. EMA 13 is still above EMA 34, but price has slipped below EMA 13 and VWAP.
- ADX at 15.4 and falling shows the post-spike move is losing steam and the market is drifting sideways. This limits downside conviction.
CHART PATTERNS
- After the sharp gap-up on Nov 4, price has formed a tight range of about $256–$264 with lower highs. It resembles a Bullish Pennant / flag from the reference diagram, but the MACD and CMF readings do not confirm a bullish breakout.
- A loose Symmetrical Triangle reading is also possible: lower highs near $263–$264 against rising lows near $256–$259. The breakout direction is unresolved, but the indicator tilt favors a downside resolution first.
- Pattern targets: a bullish pennant breakout above about $264 projects toward $270 (the upper BB). A breakdown below about $256 projects toward the $253.95 SMA50 and then the low $250s.
POTENTIAL SCENARIOS
- Scenario 1: Bearish Pullback to Support — MACD stays below signal, CMF stays in distribution, and −DI stays on top, so price fades below EMA 34 and tests the lower Bollinger Band and the SMA50 zone. Trigger: hourly close below $258.00 (EMA 34), then below $255.55. Target: $255.50, with an extension to $253.95. Invalidation: reclaim of $262 (VWAP/EMA 13) with a MACD re-cross. (45% probability)
- Scenario 2: Bullish Range Breakout — Buyers defend the EMA 34 and SMA50 support, and the pennant resolves upward in line with the long-term uptrend. Trigger: close above $264.00 with CMF back above +0.05. Target: $268–$270 (upper BB). Invalidation: close below $255.50. (30% probability)
- Scenario 3: Neutral Range Consolidation — With ADX under 20, price chops between $256 and $263 until the end of the window. Trigger: ADX stays below 20 with no close outside the range. Target: $259–$261. Invalidation: close outside $255.50–$264. (25% probability)
PRICE TARGETS
- Target Price: $255.50 (13-day horizon)
- Expected Range: $246.50 to $267.50 (width $21.00, about 8.1% of current price, in line with the 7–21 day guidance)
- Key Levels: Support at $255.55 (lower Bollinger Band, with the SMA50 at $253.95 below it), Resistance at $261.96 (VWAP, with EMA 13 at $261.05 nearby)
OVERALL BIAS
OVERALL BIAS: BEARISH - A bearish MACD cross, CMF in distribution, −DI crossing above +DI, and price below both VWAP and EMA 13 point to a pullback toward the lower Bollinger Band and SMA50 support. The weak ADX and the intact long-term uptrend (above the SMA50 and SMA200) limit the downside, so conviction is modest.
This is educational analysis and not financial advice.