AAPL 13-day bearish forecast — Nov 8, 2026
- Bias: Bearish
- Timeframe: 13 days (made Nov 8, 2026, target date Nov 20, 2026)
- Price at analysis: $342.37
- Price target: $336.50
- Expected range: $327.50 – $353.50
- Result: Pending — graded after the close on Nov 20, 2026
Get a free AI analysis of AAPL today
Analysis
TECHNICAL INDICATORS
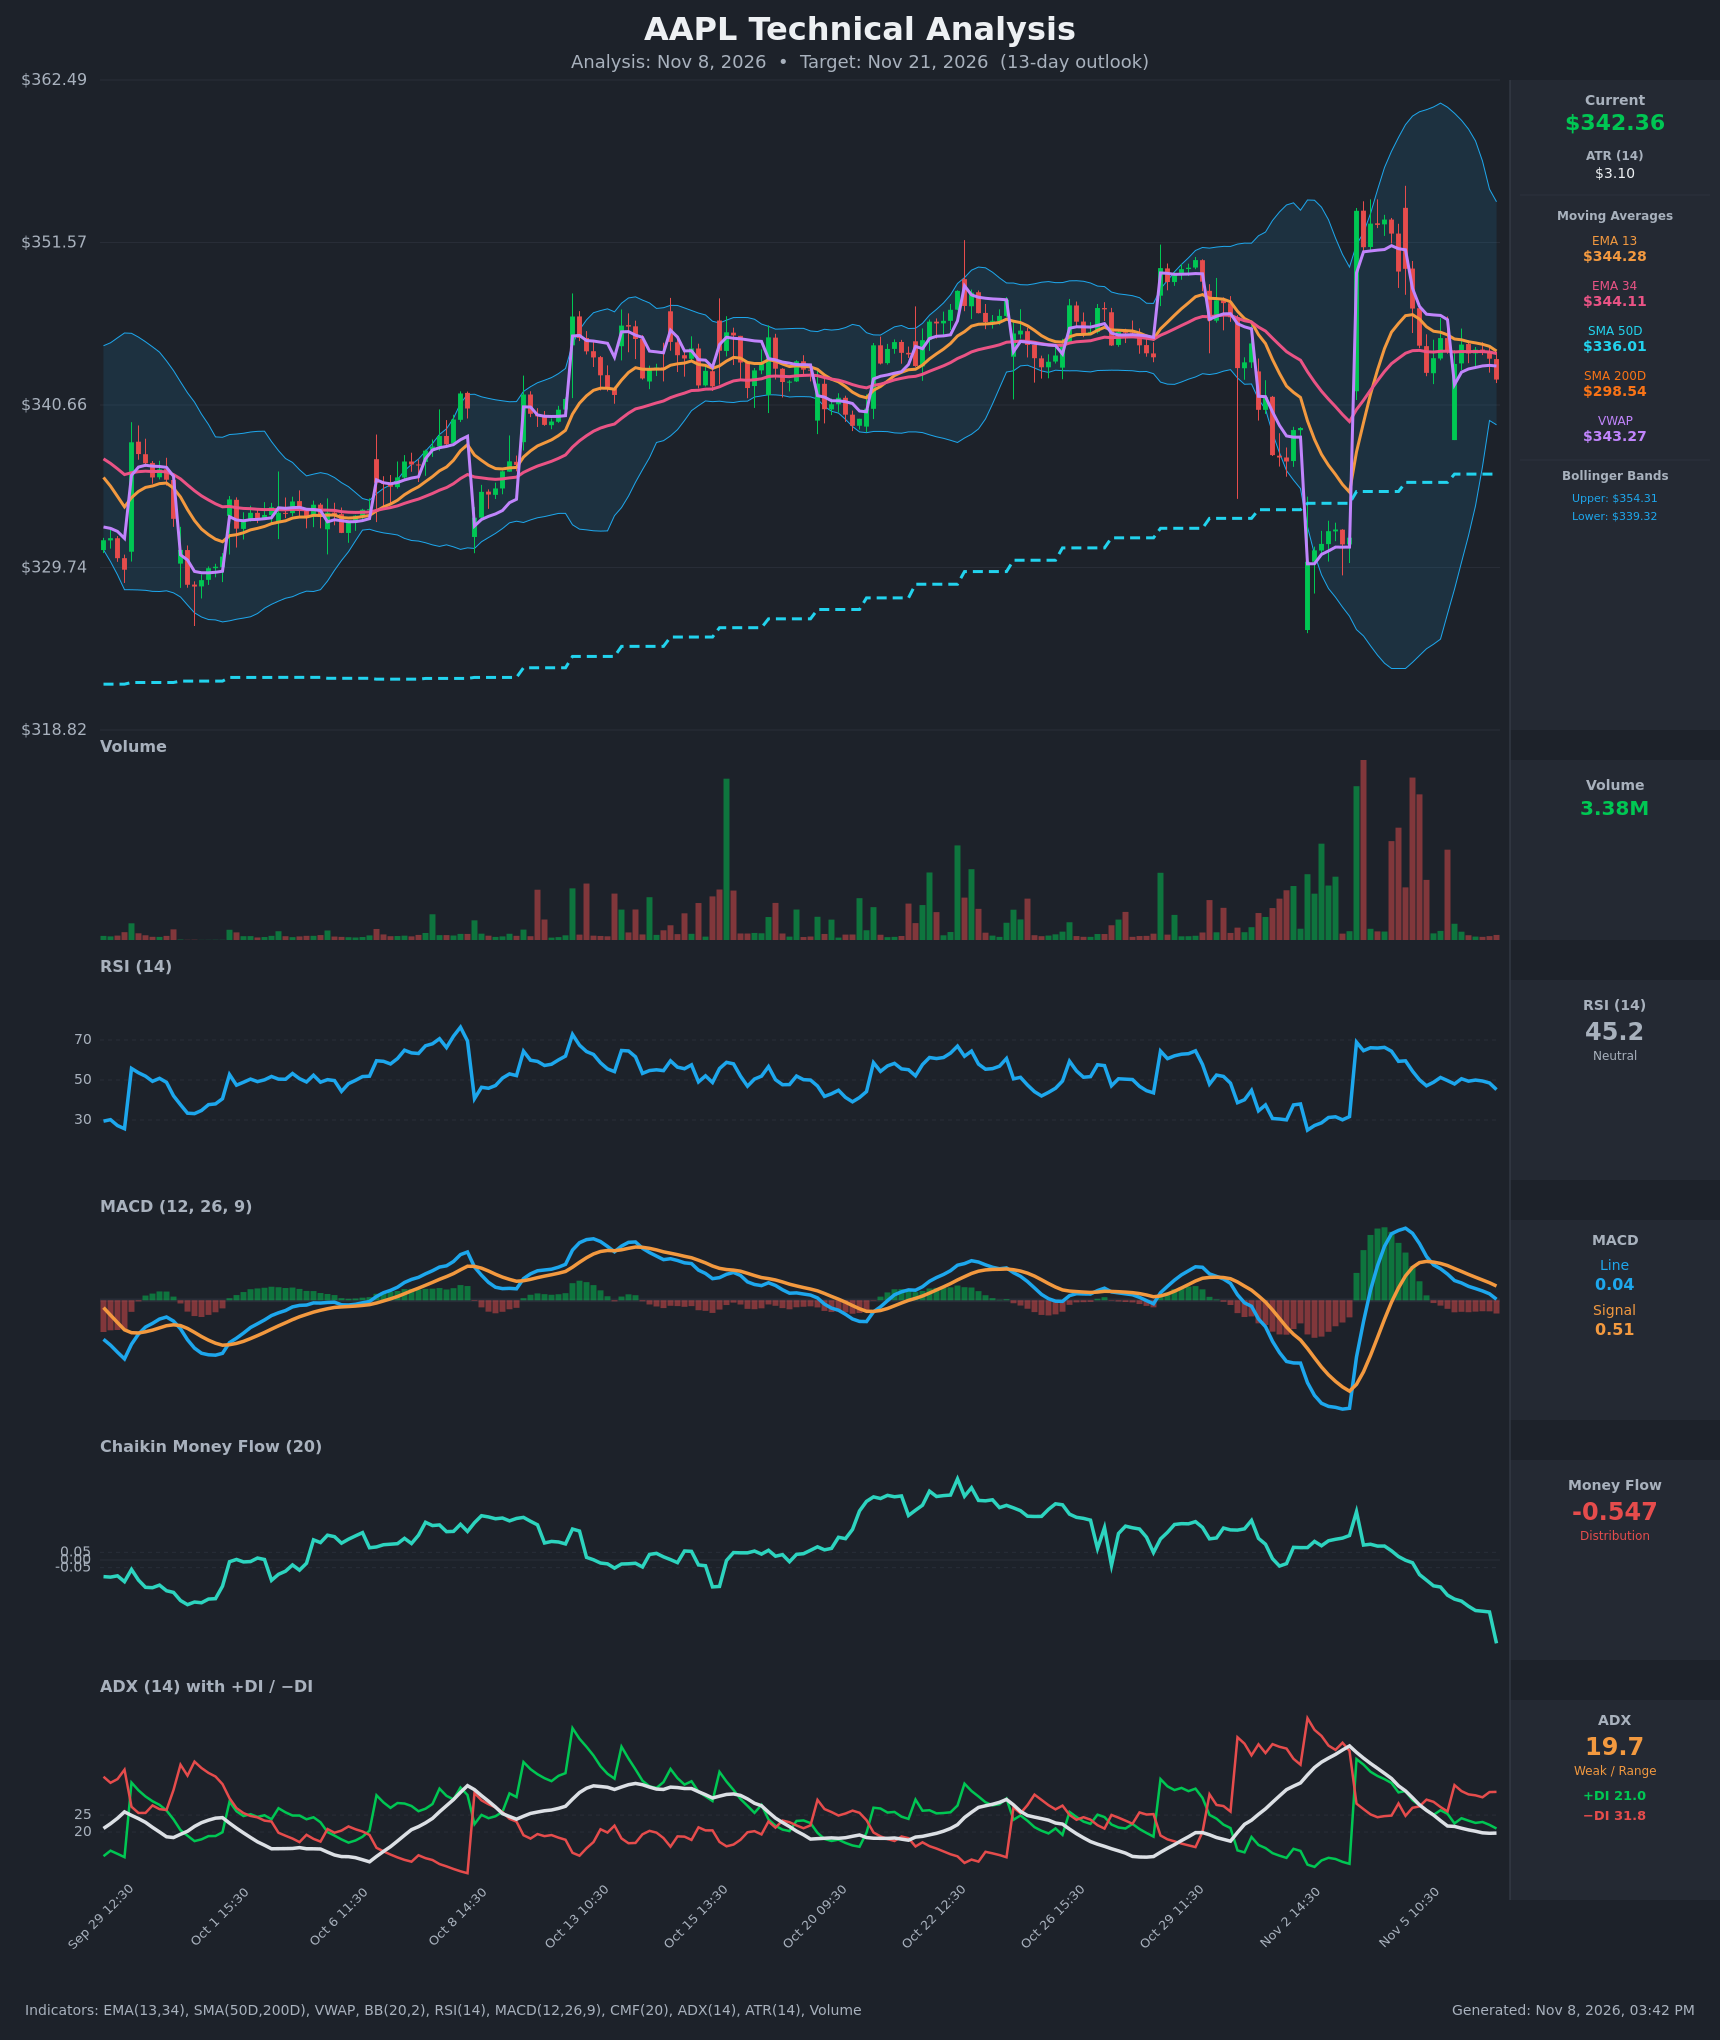
- RSI (14): 45.2, slipping from ~50 over the last several bars and now below the midline. Momentum is fading but not oversold, so there is room to fall before a bounce is likely. [Bearish]
- 20 EMA: The chart shows EMA 13 at $344.28 and EMA 34 at $344.11. Price ($342.36) is below both, and the EMAs are flattening and converging, with EMA13 barely above EMA34. The cluster at ~$344 is now overhead resistance. [Bearish]
- MACD: Line 0.04 against Signal 0.51, so the line crossed below the signal in the Nov 5 session. The histogram is negative and the line is heading toward zero. The momentum peak from the early-Nov spike is fully unwinding. [Bearish]
- Bollinger Bands (20): Upper $354.31, lower $339.32, with the middle band near $346.8. Price is in the lower half, about $3 above the lower band. The bands are very wide after the volatile gap and sell-off and are starting to contract. A move to the lower band is plausible, but the wide bands also leave room for chop. [Neutral]
- CMF (20): -0.547, far below the -0.05 threshold and falling steadily from about 0 on Nov 4. This is heavy, accelerating distribution, the most bearish reading on the chart. [Distribution]
- ADX (14): 19.7 and falling, so the trend is weak. −DI (31.8) is well above +DI (21.0), so sellers hold the edge. The directional lean is bearish, but a trend is not yet established. [Weak Trend, Bearish lean]
- Volume: 3.38M on the latest bar, light compared with the heavy volume on the Nov 3–5 gap and sell-off bars. The largest recent volume clusters are on red candles, which points to distribution. Light volume on the current drift suggests a lack of buying conviction. [Bearish]
Other levels:
- Price is below VWAP ($343.27), which is a mild bearish signal.
- Price is above SMA50D ($336.01) and well above SMA200D ($298.54), so the longer-term uptrend is intact.
- SMA50D is above SMA200D, a golden-cross configuration. It is a long-term backdrop, not a 13-day driver.
DIVERGENCES & TRENDS
- No bullish divergence: RSI, MACD and CMF all made lower highs after the early-Nov spike while price held in the $342–$345 area. CMF is making new lows with price still near its range, which is a bearish confirmation. It shows selling pressure building under a stable-looking surface.
- Money flow trend: CMF has rolled over from about 0 to -0.55 in a few sessions. This is the steepest deterioration of the indicators.
- Momentum: The MACD bearish crossover (0.036 vs 0.505) and the DI flip to −DI dominance (31.8 vs 21.0) both occurred in the last several bars.
- Trend strength: ADX is falling toward 19–20 from 33, so the prior trend burst is exhausted. This favors a grind lower or a choppy range rather than an impulsive move.
- Moving averages: The 13/34 EMA pair is flat and tangled. Price has just lost the cluster, a mild bearish break. The SMA50D rising to $336 is the next major dynamic support.
CHART PATTERNS
- Descending triangle / lower-high compression (bearish continuation, per diagram): Highs have stepped down ($349.8 → $345.2 → $344.7 → $344.4) against horizontal support around $342–$343. A decisive break below $342 projects roughly the pattern's height (about $7–$8) to the $335–$336 area, which coincides with SMA50D.
- Post-spike consolidation: After the early-Nov gap-up and reversal, price is basing under the EMA cluster. This is a weak bearish pennant-like structure, but with ADX under 20 it is not strongly confirmed.
- Pattern limitation: No clean reversal pattern, such as a double bottom, is present. A rise back above $344–$346 on volume would neutralize the bearish read.
POTENTIAL SCENARIOS
- Scenario 1: Bearish Breakdown to SMA50 — Distribution (CMF -0.55), −DI dominance and the MACD cross push price below the $342 support. Sellers drive a move toward the lower Bollinger Band and the rising SMA50D. Trigger: a close below $341.5–$342 with expanding volume. Target: $335–$337, with an extension to $330 on a break of SMA50D. Invalidation: a close above $346 (the EMA cluster plus VWAP area). (55% probability)
- Scenario 2: Neutral Range Chop — ADX stays under 20 and price oscillates between the lower Bollinger Band (~$339) and the EMA cluster (~$344–$346). Trigger: no volume expansion and RSI holding 40–55. Target: $339–$346. Invalidation: a close outside $337–$349. (25% probability)
- Scenario 3: Bullish Rebound — Price holds the lower band, oversold bounce traders step in, and the long-term uptrend above SMA200D reasserts. Trigger: reclaim of $344.3 and VWAP, with CMF turning up. Target: $349–$352. Invalidation: a failure back below $342. (20% probability)
PRICE TARGETS
- Target Price: $336.50 (13-day horizon)
- Expected Range: $327.50 to $353.50 (width $26.00, about 7.6% of the current price, consistent with a ~13-day horizon)
- Key Levels: Support at $336.01 (SMA50D), Resistance at $344.28 (EMA13 / overhead cluster)
OVERALL BIAS
OVERALL BIAS: BEARISH - CMF at -0.55 shows heavy distribution, −DI is well above +DI, the MACD crossed down, and price has lost the EMA cluster and VWAP under falling highs. The most likely path is a move toward the rising SMA50D near $336. Weak ADX and the long-term uptrend above SMA200D limit conviction.
This is educational analysis and not financial advice.