GOOGL 13-day bearish forecast — Nov 8, 2026
- Bias: Bearish
- Timeframe: 13 days (made Nov 8, 2026, target date Nov 20, 2026)
- Price at analysis: $284.72
- Price target: $279.00
- Expected range: $268.00 – $296.00
- Result: Pending — graded after the close on Nov 20, 2026
Get a free AI analysis of GOOGL today
Analysis
TECHNICAL INDICATORS
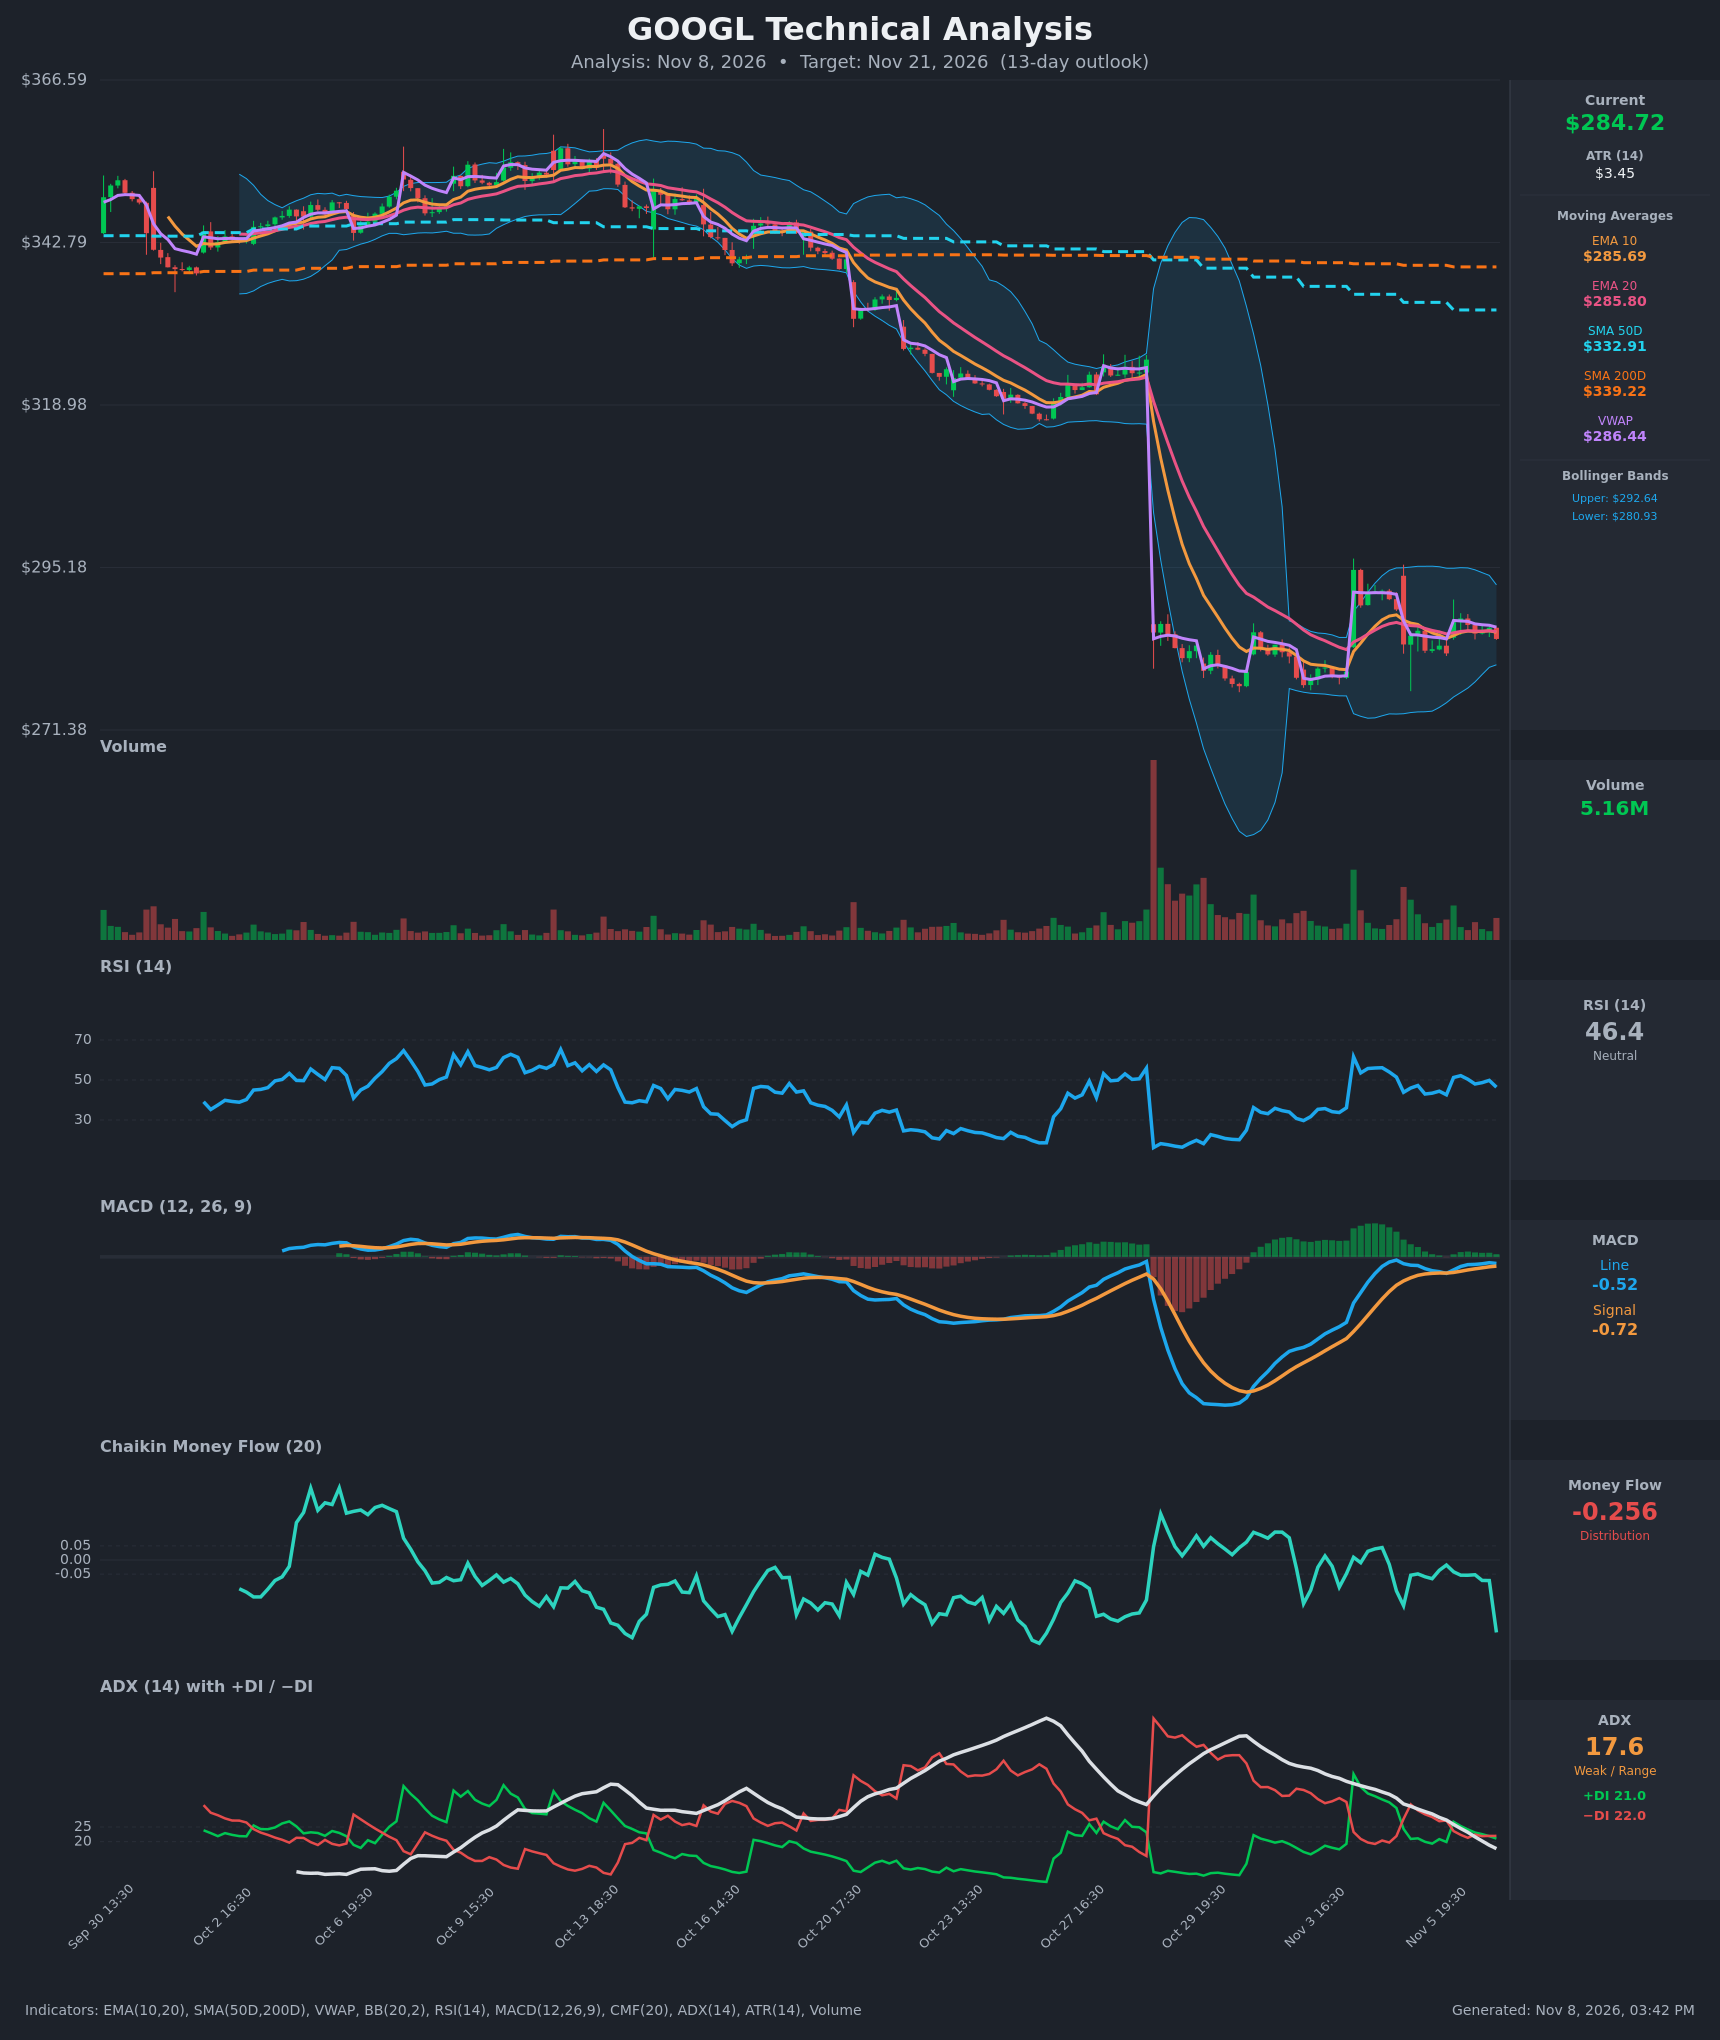
- RSI (14): 46.41, just under the 50 midline and well away from the extremes. It was 51-52 on Nov 6 morning and has rolled over to 46, so momentum is fading slightly. [Neutral]
- 20 EMA: $285.80. Price ($284.72) is just below it, and EMA10 ($285.69) has slipped under EMA20, a minor bearish cross. Both averages are flat, so they act as a magnet and light resistance rather than a trend signal. [Bearish]
- MACD: Line -0.515, signal -0.725, histogram about +0.21. The line is still above the signal after an earlier bullish cross, but the histogram is shrinking (about +0.32 to +0.21) and the line ticked down from -0.457. Both lines are below zero, so the bullish cross looks like it is fading. [Neutral]
- Bollinger Bands (20): Upper $292.64, lower $280.93, midline about $286.79. Price sits just below the midline in the lower half. The bands have contracted sharply from the huge post-gap expansion, which points to a coiling range and a pending volatility expansion. [Neutral]
- CMF (20): -0.256, far below the -0.05 threshold. It dropped from about -0.07 to -0.26 in the last bar, so selling pressure is heavy even while price holds the range. [Distribution]
- ADX (14): 17.6 and falling from 34.9, so the trend is weak. +DI (21.0) and −DI (22.0) are nearly equal, with the bears marginally on top. The prior selloff trend has exhausted into consolidation. [Weak Trend, slight bearish tilt]
- Volume: 5.16M, quiet compared with the huge gap-down spike and the Nov 3 surge. The consolidation is on subdued participation, so a breakout in either direction is not yet confirmed. [Neutral / low conviction]
DIVERGENCES & TRENDS
- Bearish CMF divergence: Price has held flat at $283-287 while CMF collapsed to -0.256, a sign of distribution under a stable price.
- Long-term trend: Price is about $48 below the SMA50D ($332.91) and about $54 below the SMA200D ($339.22). The SMA50D is below the SMA200D (death cross in place), and both are still falling.
- VWAP and EMAs: Price is below VWAP ($286.44) and the 10/20 EMAs. The EMAs have flattened and converged on price, so there is no trend, but every overhead average is resistance.
- MACD: The bullish cross is losing steam, and the zero line is overhead.
- ADX/DI: ADX has fallen from the mid-30s to under 18, and the DI lines have converged. The market is deciding its next direction, and a −DI cross above +DI with ADX turning up would confirm a downside break.
- Range: Price has been stuck between roughly $279 and $293-295 since the Oct 29 gap. A rejection at the $292-295 area (Nov 3 spike and fade) caps rallies.
CHART PATTERNS
- Bearish Pennant / Flag (continuation): After the sharp gap-down from about $320 to $285, price is consolidating in a tight, low-volume range. This matches the bearish continuation structure in the reference diagram. A break below about $279-281 would target roughly $270 and lower, and a full measured move would be far lower.
- Rectangle / Triple-Top-like cap: Repeated failures at $292-295 give a resistance ceiling, which fits the bearish bias.
- Counter-view: A close above $292.64 and then $295 would invalidate the bearish continuation read and open a retracement toward the gap near $300-305. The weak ADX and flat EMAs mean the pattern has not resolved yet.
POTENTIAL SCENARIOS
- Scenario 1: Bearish Pennant Breakdown — The distribution signaled by CMF resolves lower and price breaks the bottom of the range, continuing the post-gap downtrend. Trigger: close below $280.93 (lower BB), then below the $278-279 range low, with −DI rising above +DI. Target: $272-$275, with an extension toward $268. Invalidation: close back above $288 (EMA/VWAP zone) on rising volume. (45% probability)
- Scenario 2: Neutral Range Persistence — Weak ADX and compressed bands keep GOOGL oscillating between about $280 and $292 for most of the window. Trigger: repeated tests of both band edges with no volume expansion. Target: $283-$289. Invalidation: a close outside $279 or $293. (28% probability)
- Scenario 3: Bullish Range Breakout — Buyers push through resistance and fill part of the gap. Trigger: close above $292.64, then $295 on increased volume, with CMF recovering above 0. Target: $300-$304. Invalidation: failure back below $286 (EMA/VWAP). (27% probability)
PRICE TARGETS
- Target Price: $279.00 (13-day target, about -2.0% from current)
- Expected Range: $268.00 to $296.00 (width $28.00, about 9.8% of current price, consistent with the 8-12% guide for ~13 days)
- Key Levels: Support at $278.00, Resistance at $292.64
OVERALL BIAS
OVERALL BIAS: BEARISH - Price is below every major moving average (death cross in place), CMF at -0.256 signals heavy distribution, and the tight consolidation after the gap-down resembles a bearish pennant. The fading MACD cross and weak ADX argue against a big move, so the call is a modest downside drift toward $279.
This is educational analysis and not financial advice.