IBM 13-day bearish forecast — Nov 8, 2026
- Bias: Bearish
- Timeframe: 13 days (made Nov 8, 2026, target date Nov 20, 2026)
- Price at analysis: $244.95
- Price target: $240.50
- Expected range: $232.50 – $251.50
- Result: Pending — graded after the close on Nov 20, 2026
Get a free AI analysis of IBM today
Analysis
TECHNICAL INDICATORS
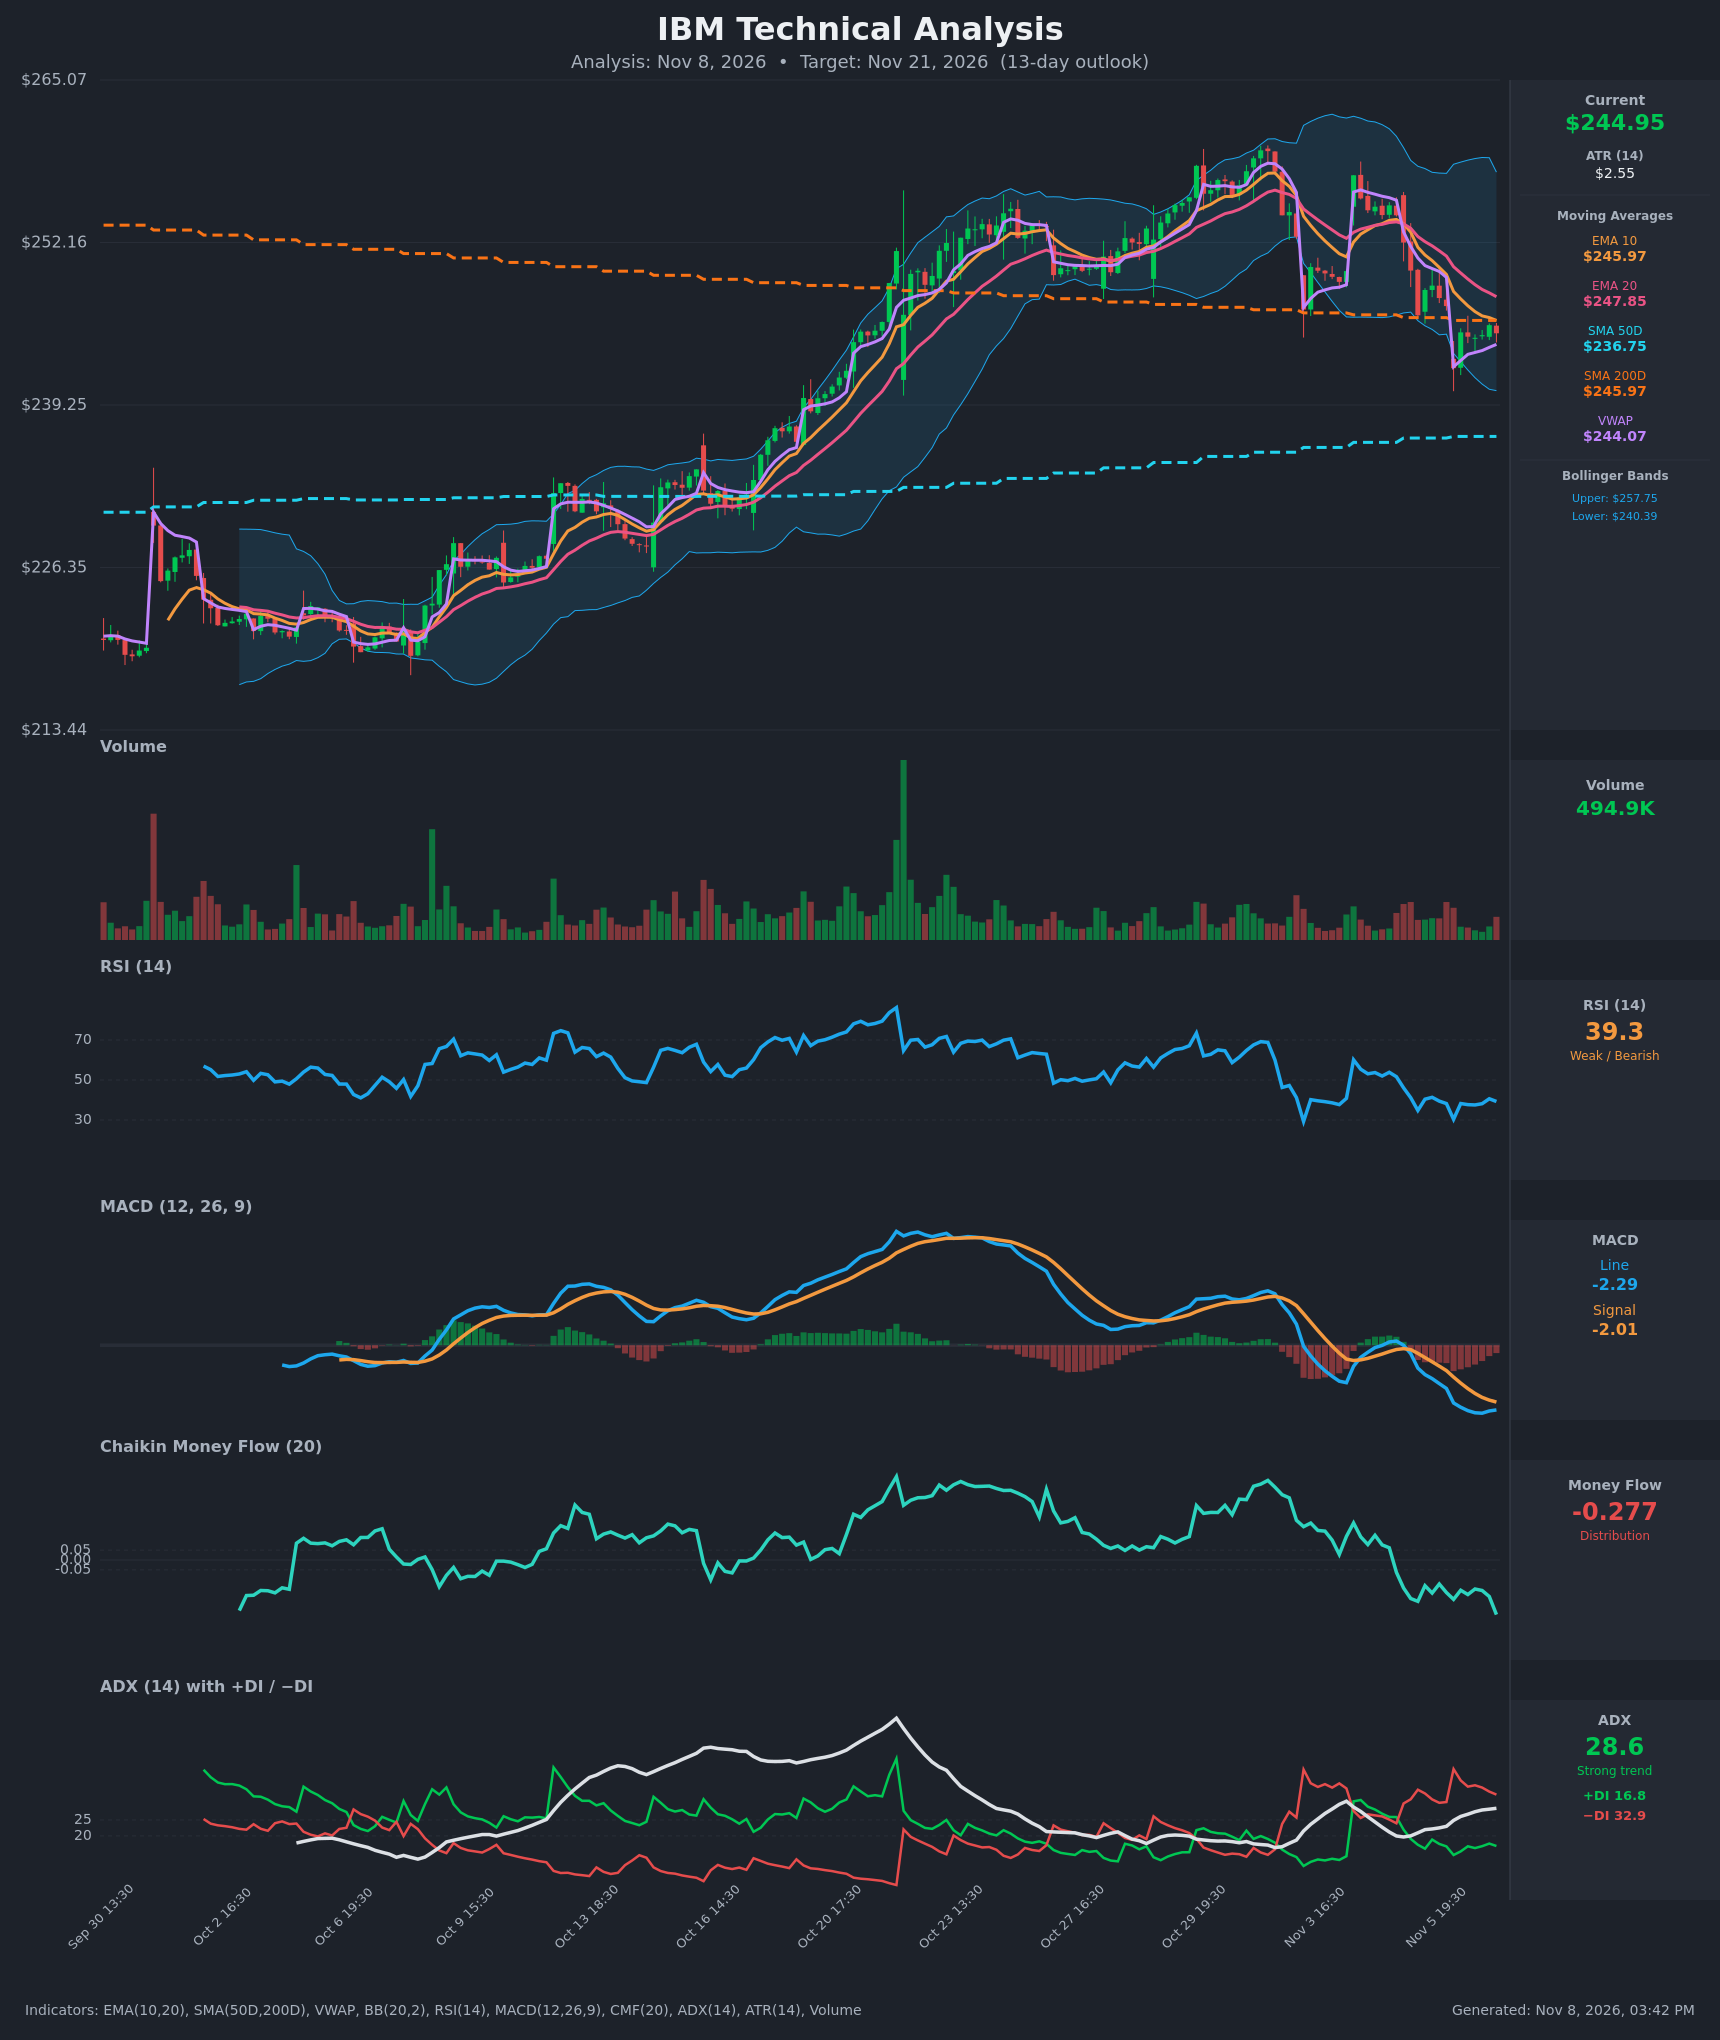
- RSI (14): 39.26, down from the 60s in late October and ranging 30–41 over the last several sessions. It is weak but not oversold (<30). It bounced off 30.3 on Nov 6 and has made no new momentum low since. [Bearish]
- 20 EMA: $247.85, with price at $244.95 below it. EMA10 ($245.97) is also above price and has been below EMA20 since Nov 5, so this is a bearish cross. The 20 EMA is overhead resistance. [Bearish]
- MACD: Line -2.287 is below the signal at -2.010, with the histogram negative and widening over the last few sessions. The line is slightly above its Nov 6 low of -2.403, so downside momentum may be flattening. The bearish cross from Nov 5 remains in force. [Bearish]
- Bollinger Bands (20): Upper $257.75, lower $240.39, middle about $249. Price sits in the lower half, roughly 26% of the band width from the lower band. The bands are wide, which leaves room for movement, and the lower band is the nearest downside test. [Bearish]
- CMF (20): -0.277, well below -0.05 and falling steadily from positive readings in late October. This is clear distribution. [Distribution]
- ADX (14): 28.6 and rising, above 25. −DI at 32.9 is far above +DI at 16.8, so the trend is strong and bearish. [Strong Trend – Bearish]
- Volume: 494.9K, an average-to-light reading on the latest bar. There were no capitulation spikes on the selloff, and the drop from $254 to $242 came on moderate volume. The bounce is not showing strong buying interest. [Neutral / Mildly Bearish]
Moving average context:
- Price is $244.95 against SMA200D at $245.97, a marginal break below the long-term average.
- SMA50D at $236.75 is rising and sits about 3.3% below price, making it the next structural support.
- Price is slightly above VWAP ($244.07), which is a small positive for the session.
DIVERGENCES & TRENDS
- No clear bullish divergence. RSI at 39 held above its 30.3 low while price held above $242.18, which is a minor stabilization sign but not a real divergence.
- MACD, CMF and ADX/DI all point down together, so momentum, flow and trend strength agree.
- Bearish EMA10/EMA20 cross has occurred, and price has lost the 200-day SMA.
- RSI broke below its 50 midline in early November and has stayed below it.
- CMF fell from about +0.2 to -0.277, which is distribution after the October rally.
- DI spread is wide, with −DI roughly double +DI.
- Price is stabilizing around $244–245 after the $242.18 low and sits near the 200-day SMA.
CHART PATTERNS
- The October rally from about $220 to $254 formed a rounded advance, followed by a lower-high structure. Price topped near $254 and has stepped down from it, which is consistent with a Bearish Double Top shape (peaks near $254 on Oct 31 and Nov 4–5), with neckline support near $242–245.
- The neckline sits around $242, and the Nov 6 low of $242.18 has tested it once. A break below it would project a measured move of roughly $254 − $242 = $12, which is about $230. That is a longer-range target, and the SMA50D at $236.75 is a likely interim stop.
- The small range over the last six bars at $244–245.6 resembles a Bearish Flag/Pennant after the sharp drop, which would also resolve lower.
- The pattern is not confirmed until the $242 neckline breaks on a close.
POTENTIAL SCENARIOS
- Scenario 1: Bearish Neckline Break and Move Toward SMA50D — Distribution, a bearish MACD cross, strong −DI and the loss of the SMA200D drive a break of the $242 neckline. Trigger: a close below $242.00 with CMF staying below -0.05. Target: $237–$238, near the SMA50D at $236.75. Invalidation: a daily close back above $248 (EMA20) with MACD turning up. (55% probability)
- Scenario 2: Neutral Range Consolidation — Price stays pinned between $242 support and the $247.85–$250 EMA20 and SMA200D resistance zone as the selloff stalls. Trigger: failure to break $242 and a rejection at $248. Target: $243–$248. Invalidation: a close beyond either boundary. (25% probability)
- Scenario 3: Bullish Relief Rally — A bounce from the oversold-leaning RSI reclaims the SMA200D and EMA20. Trigger: a close above $248 on rising volume. Target: $252–$254, the prior highs and upper-mid Bollinger zone. Invalidation: a drop below $242. (20% probability)
PRICE TARGETS
Timeframe: 13 days (Nov 21). ATR of $2.55 implies roughly ±$9 over 13 days at about 1-sigma, though it is partly absorbed by mean reversion.
- Target Price: $240.50 (for the exact 13-day timeframe)
- Expected Range: $233.50 to $249.50 (width $16.00, about 6.5% of the current price). This is slightly narrower than the 8–12% guide for 14–21 days. The 13 day horizon sits between the 7–10 and 14–21 day bands, so I widen it to about 8% for consistency: $232.50 to $251.50 (width $19.00, 7.8%). I am using this final range.
- Key Levels: Support at $242.00 (neckline), then $236.75 (SMA50D). Resistance at $247.85 (EMA20), then $250 and $254.
Final Expected Range: $232.50 to $251.50.
OVERALL BIAS
OVERALL BIAS: BEARISH - A bearish EMA and MACD cross, deeply negative CMF (-0.277), and a strong ADX (28.6) with −DI at roughly double +DI point lower, and price has lost the SMA200D with the double-top neckline at $242 nearby. The target of $240.50 sits above the SMA50D, which is the likelier next support.
This is educational analysis and not financial advice.