NOK 13-day bearish forecast — Nov 8, 2026
- Bias: Bearish
- Timeframe: 13 days (made Nov 8, 2026, target date Nov 20, 2026)
- Price at analysis: $7.66
- Price target: $7.45
- Expected range: $6.95 – $8.05
- Result: Pending — graded after the close on Nov 20, 2026
Get a free AI analysis of NOK today
Analysis
TECHNICAL INDICATORS
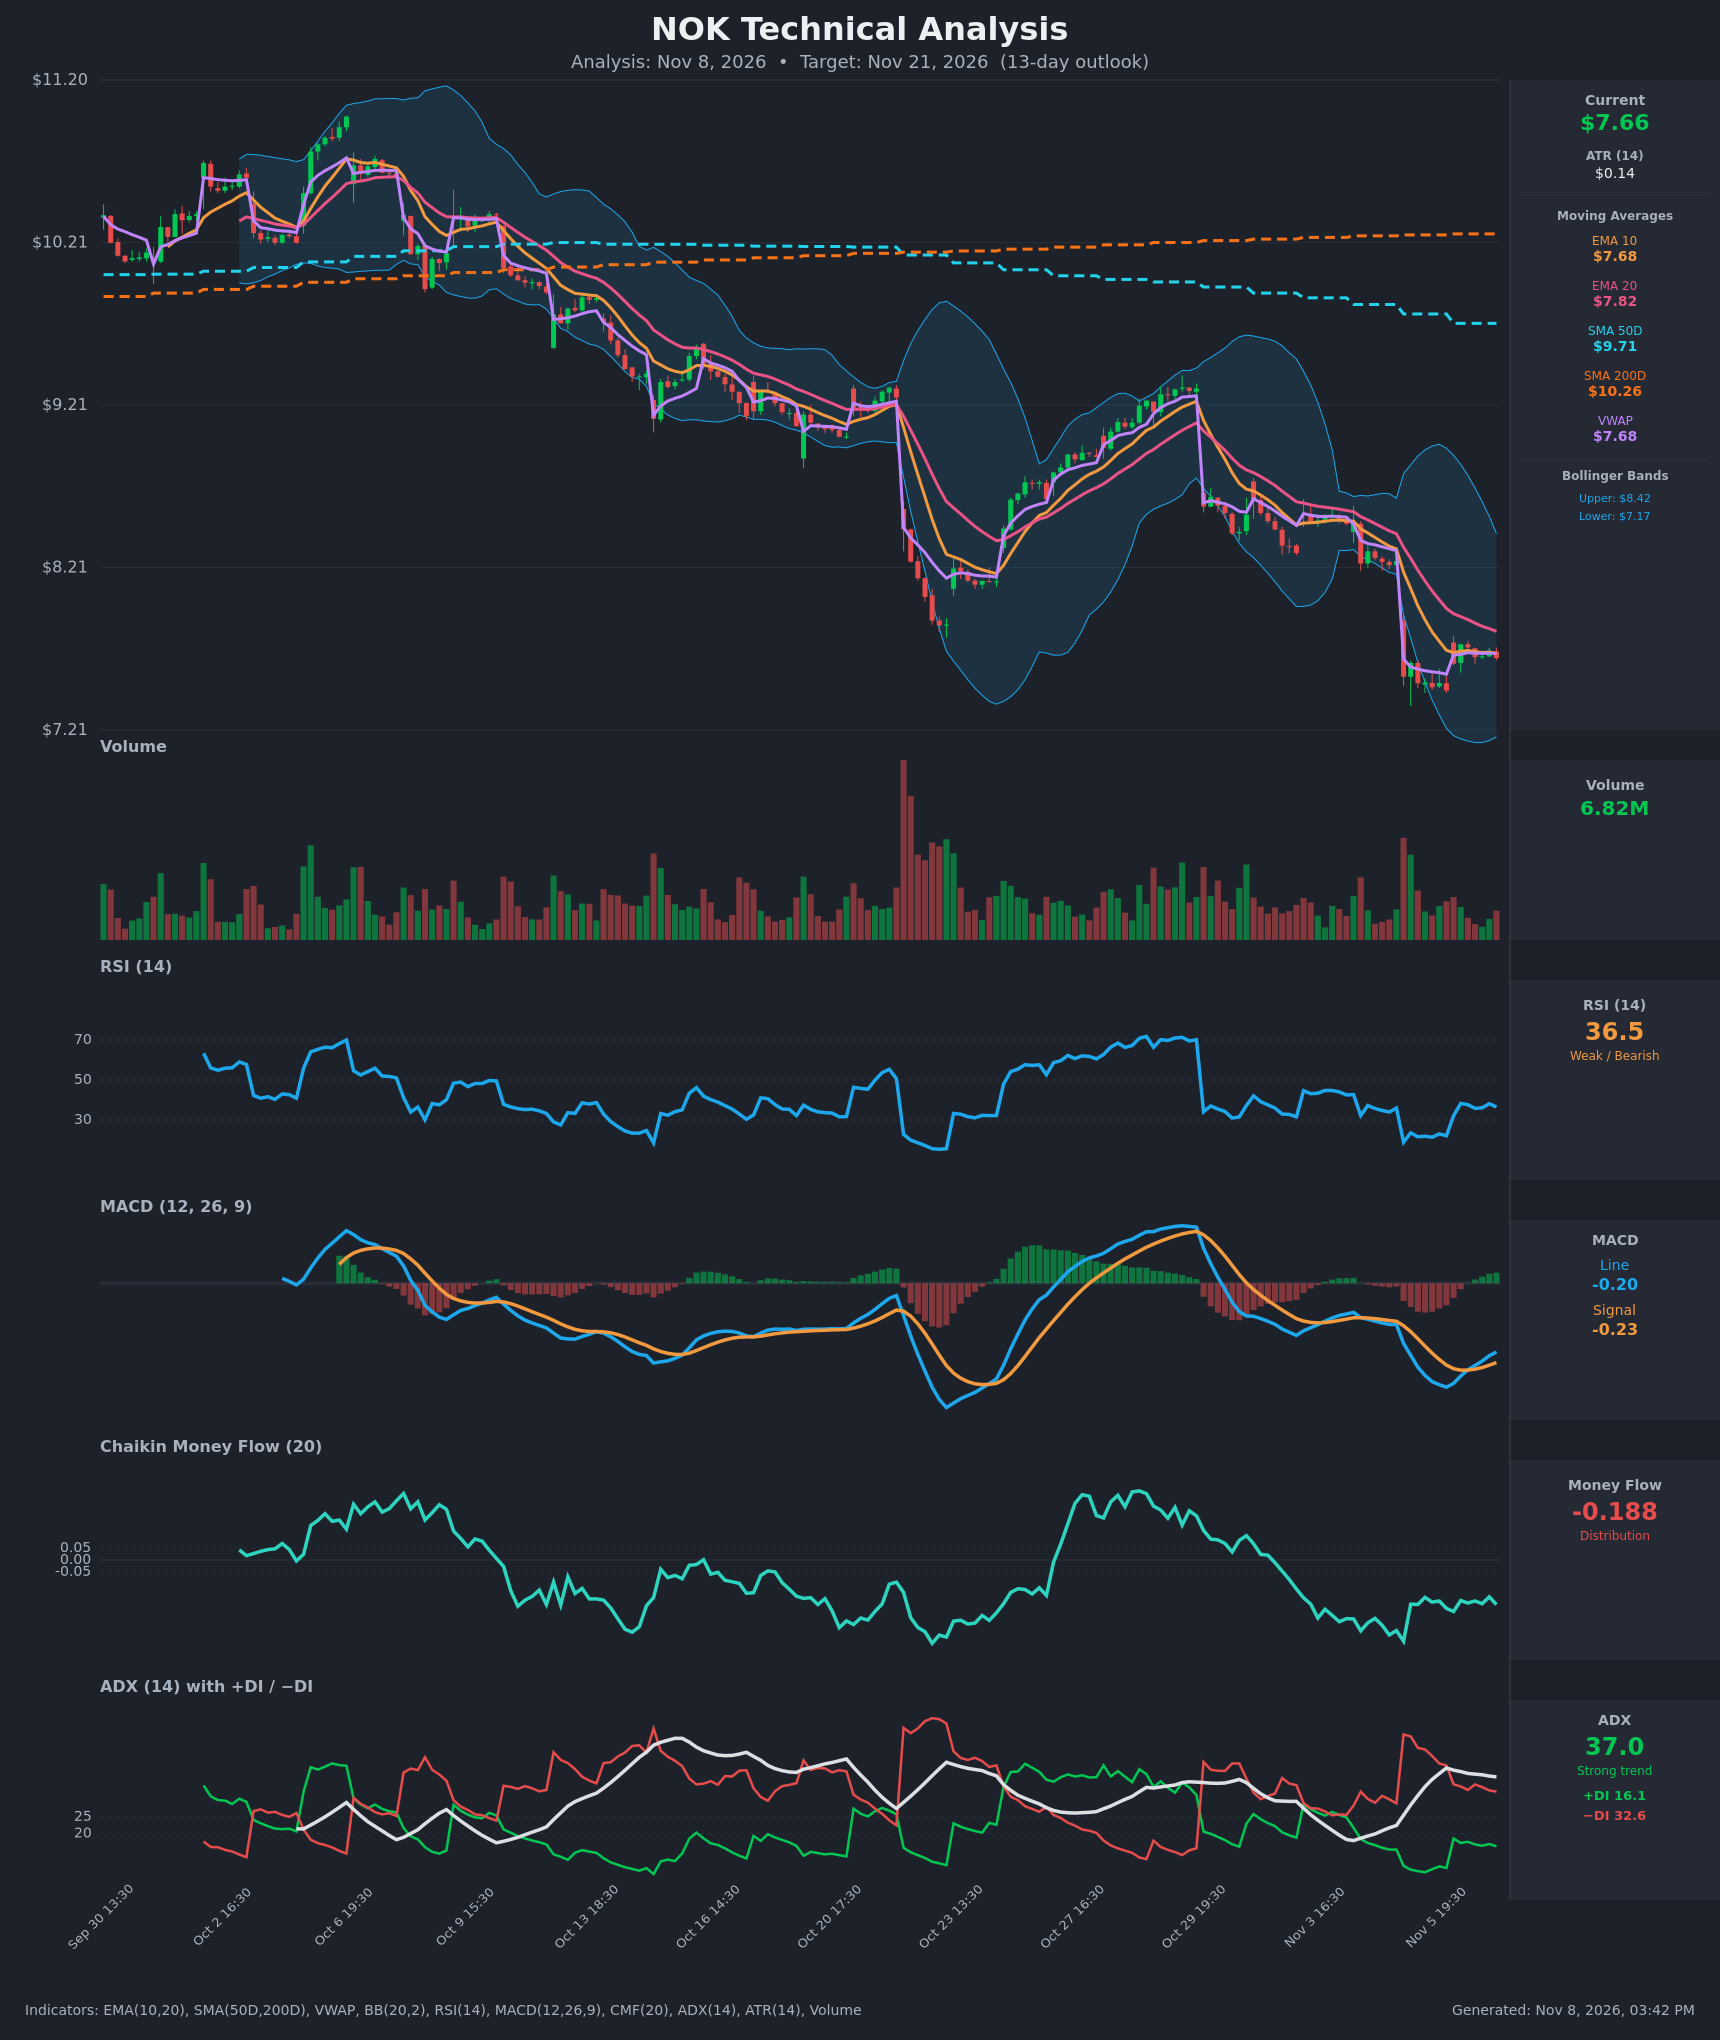
- RSI (14): 36.52, recovering from a deeply oversold 18.9 on Nov 5 but still below 50 and stuck in the 32-38 band for the past several bars. Momentum has bounced but is not yet strong. [Bearish]
- 20 EMA: $7.8182, with price at $7.655 below it, and EMA10 ($7.6841) is also above price. EMA10 sits below EMA20 (bearish alignment) and both are sloping down. The 20 EMA is the first overhead resistance. [Bearish]
- MACD: Line -0.2003 is above Signal -0.2311, so a bullish crossover occurred around Nov 6 16:30. The histogram is slightly positive (+0.03) and rising, but both lines remain deeply below zero, so this is only a relief bounce within a downtrend. [Neutral]
- Bollinger Bands (20): Upper $8.42, lower $7.17, with price at $7.655 in the lower half, below the midline (~$7.79). The bands are wide after the Nov 5 gap-down, and the lower band sits about 6% below. Price has moved off the lows, but there is no squeeze or reversal signal. [Bearish]
- CMF (20): -0.188, well below -0.05 and negative for the whole decline, with no sign of accumulation. [Distribution]
- ADX (14): 37.0 with −DI 32.6 above +DI 16.1. This is a strong trend and bears are in control. ADX is flat to slightly lower, so the trend is maturing but intact. [Strong Trend – Bearish]
- Volume: 6.82M, with the big spike on the Nov 5 gap-down and fading volume during the sideways base since. Selling climax volume has dried up, which hints at stabilization but not accumulation. [Neutral-to-Bearish]
DIVERGENCES & TRENDS
- Price made a lower low on Nov 5 (around $7.46) while RSI sits at 36.5, and the bounce has stalled below 40. There is no clean bullish divergence on the hourly bars.
- MACD has crossed up from deeply negative levels, but price is just flat around $7.65-$7.74, which signals fading downside momentum rather than a new uptrend.
- Price is far below SMA50 ($9.71) and SMA200 ($10.26). A death cross is already in place (SMA50 < SMA200), and both are sloping down.
- EMA10 < EMA20 < SMA50 < SMA200 is a textbook bearish stack. VWAP ($7.68) is almost exactly at price, so the market is balanced intraday.
- A consistent pattern of lower highs and lower lows persists since early October, with rallies (such as the Oct 23-29 bounce) rejected at the declining EMAs.
CHART PATTERNS
- Price formed a small sideways consolidation after the gap-down (about $7.46-$7.74). This resembles a Bearish Pennant/Flag on the reference diagram, a continuation pattern after a sharp drop.
- The larger structure is a series of lower highs and lower lows, i.e. a broad descending channel. The Oct 29 high around $9.2 was rejected sharply.
- A breakdown below $7.46 would project a measured move toward about $7.0 or lower. A bullish alternative would be a base or double bottom near $7.46, which needs a close above $7.82 (EMA20) to confirm.
POTENTIAL SCENARIOS
- Scenario 1: Bearish Continuation Lower — Price fails at the EMA10/EMA20 cluster and VWAP, then breaks the post-gap low. Trigger: close below $7.46 on rising volume. Target: $7.10-$7.20 (lower Bollinger Band area). Invalidation: close above $7.85. (50% probability)
- Scenario 2: Neutral Base and Chop — The oversold bounce stalls and price ranges between support and the EMAs. Trigger: failed breaks of both $7.46 and $7.82. Target: $7.45-$7.85. Invalidation: decisive close outside that range. (22% probability)
- Scenario 3: Bullish Relief Rally — The MACD crossover and oversold RSI lead to a mean-reversion rally toward the middle Bollinger Band and the gap fill. Trigger: close above $7.82 (EMA20) with volume. Target: $8.25-$8.40. Invalidation: loss of $7.46. (28% probability)
PRICE TARGETS
- Target Price: $7.45 (13-day)
- Expected Range: $6.95 to $8.05 (width $1.10, about 14.4% of current price, which fits a 13-day horizon and is above a 7-10 day range)
- Key Levels: Support at $7.46 (then $7.17 lower band), Resistance at $7.82 (EMA20, then $8.42 upper band)
OVERALL BIAS
OVERALL BIAS: BEARISH - The stack of moving averages is bearish with a death cross in place, ADX is 37 with −DI well above +DI, CMF is deeply negative, and price remains below the EMAs and VWAP. The MACD bounce is only a relief move below zero, and a post-gap consolidation is more likely to resolve lower than higher.
This is educational analysis and not financial advice.