NFLX 13-day bearish forecast — Nov 8, 2026
- Bias: Bearish
- Timeframe: 13 days (made Nov 8, 2026, target date Nov 20, 2026)
- Price at analysis: $63.39
- Price target: $62.00
- Expected range: $58.90 – $66.00
- Result: Pending — graded after the close on Nov 20, 2026
Get a free AI analysis of NFLX today
Analysis
TECHNICAL INDICATORS
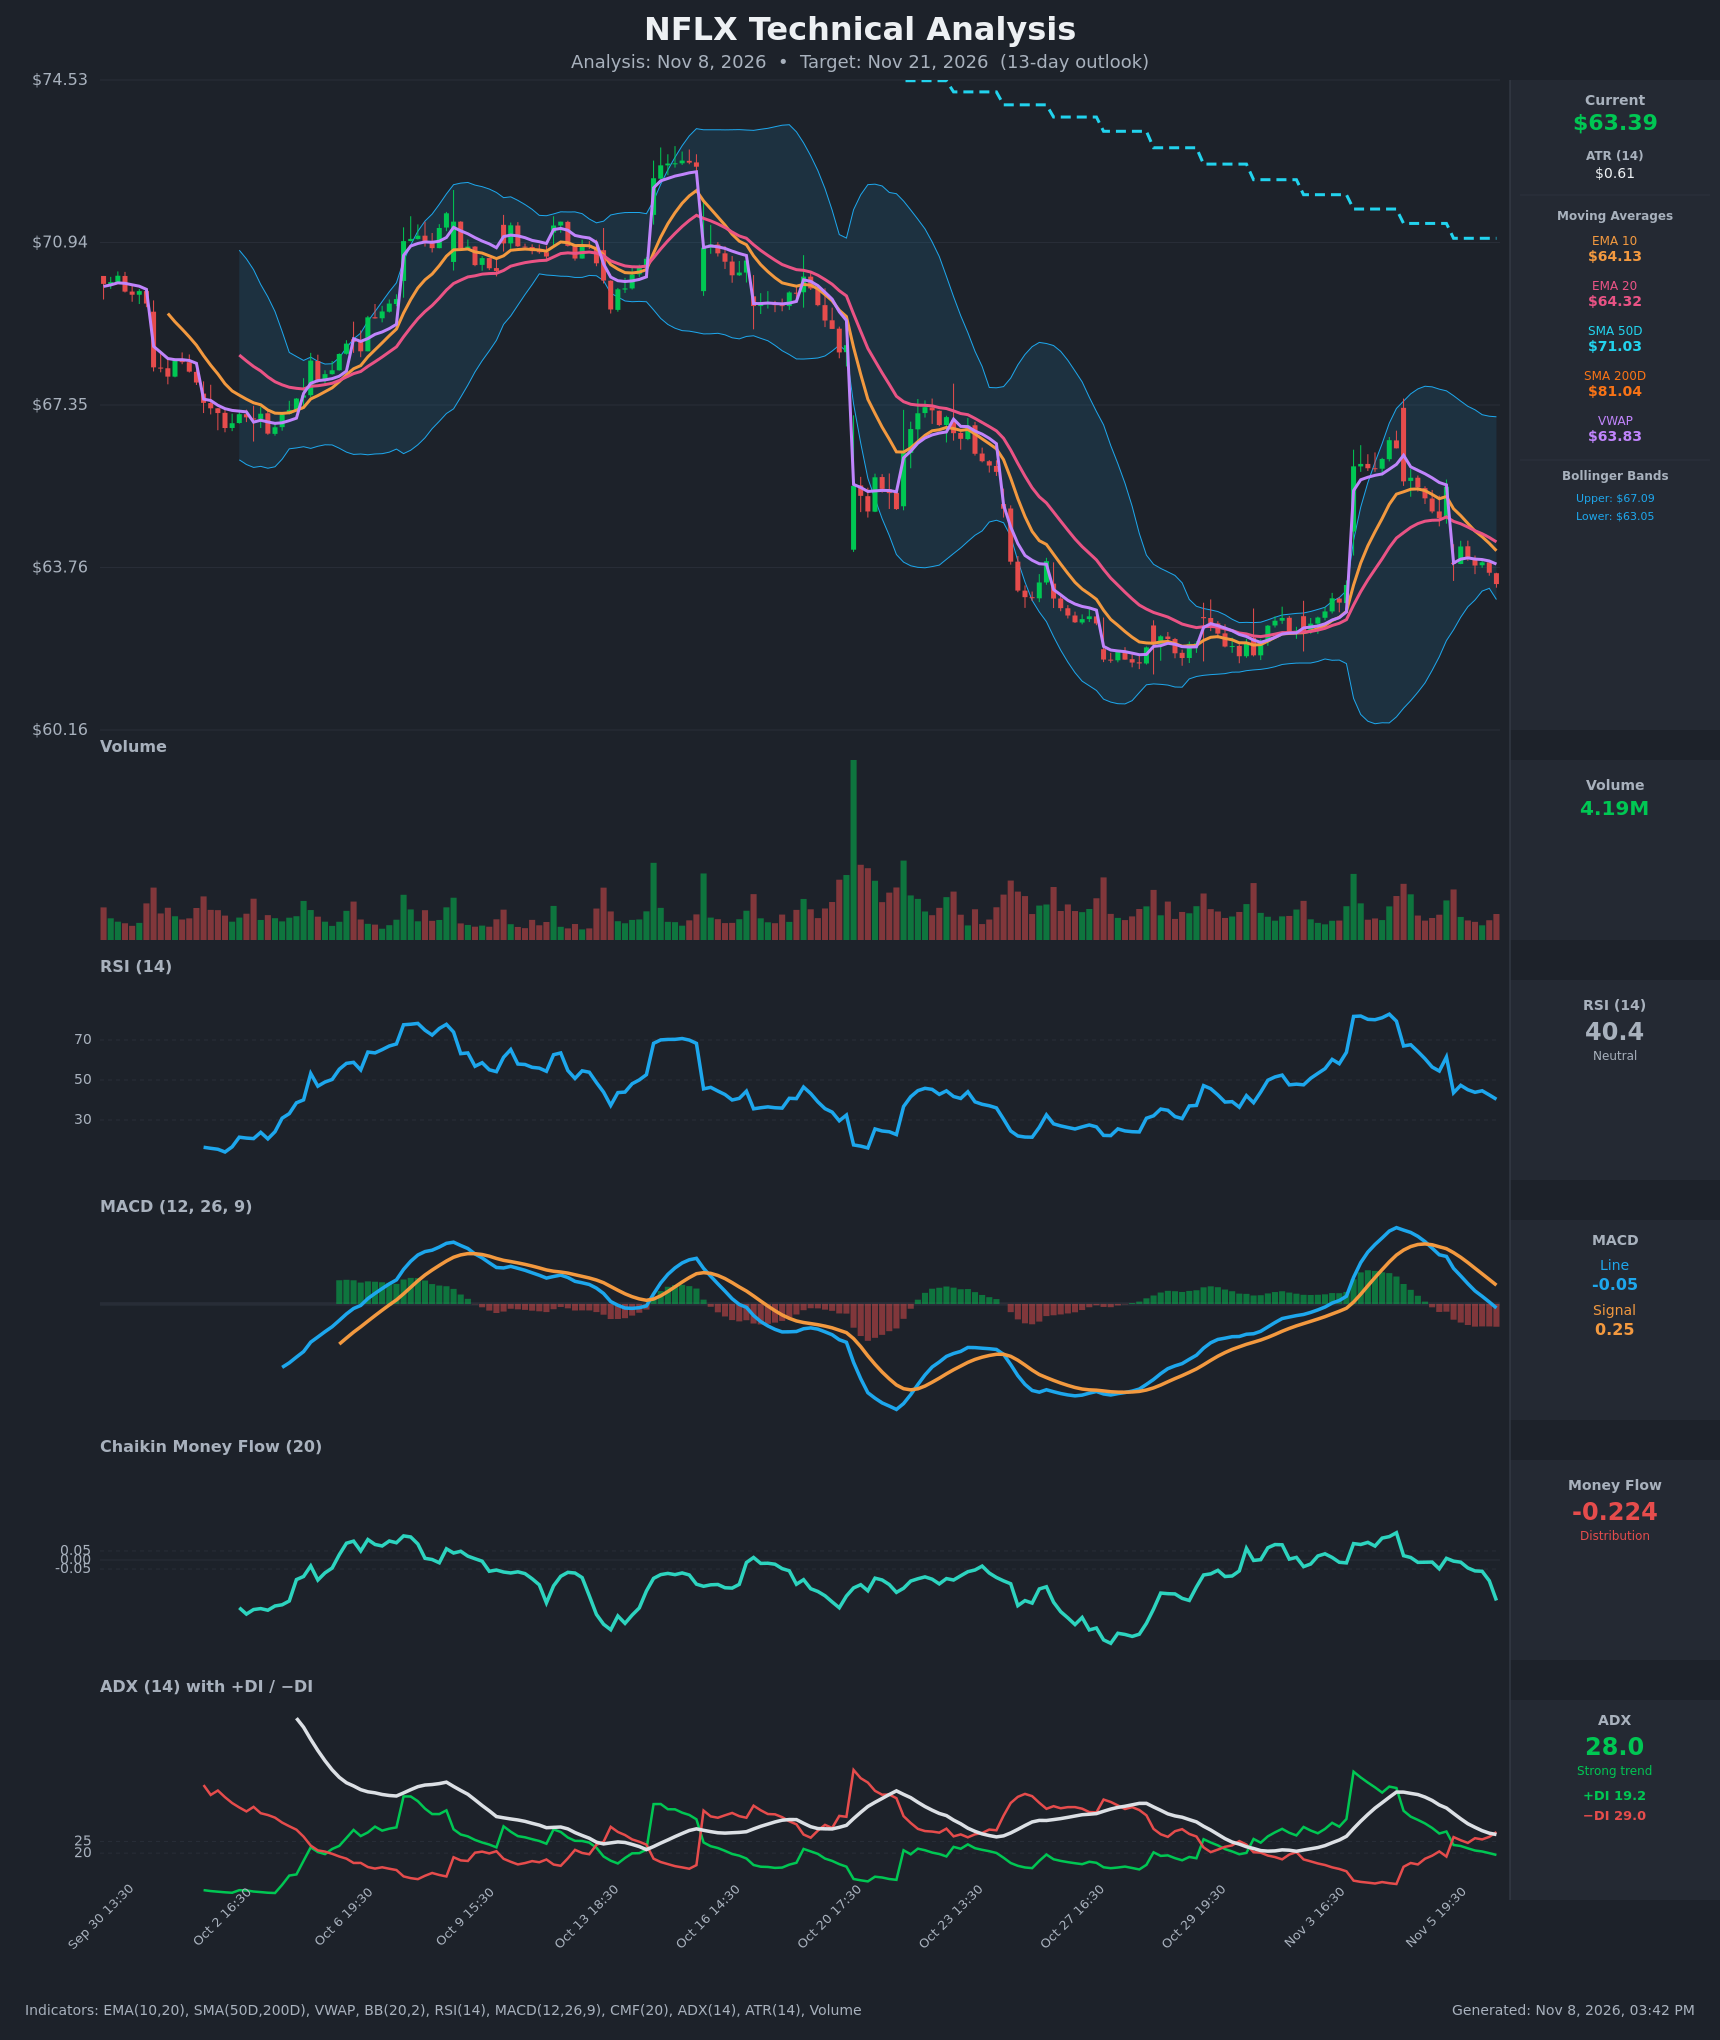
- RSI (14): 40.37, down from 79.4 on Nov 4. It has fallen steadily and is now below 50 but not yet oversold (<30). Momentum is clearly fading. [Bearish]
- 20 EMA: $64.32. Price at $63.39 is below both the 20 EMA and the 10 EMA ($64.13), and EMA10 has just crossed below EMA20 (the two were 64.29 vs 64.42 at Nov 6 19:30). Both averages are now overhead resistance. [Bearish]
- MACD: Line -0.054 vs Signal 0.252, a fresh bearish crossover around Nov 6 19:30–20:30. The histogram is negative (about -0.31) and widening, and the line has just dropped below zero. [Bearish]
- Bollinger Bands (20): Upper $67.09, lower $63.05, so price at $63.39 sits in the lower band, only $0.34 above the lower band. The bands have narrowed from the earlier expansion. A close below the lower band would signal a downside continuation or an oversold stretch. The spike to the upper band on Nov 4 has fully reversed. [Bearish]
- CMF (20): -0.224, a sharp fall from +0.15 two sessions ago, well below -0.05. This is strong distribution and selling pressure, and it is still worsening. [Distribution]
- ADX (14): 28.0, falling from 46 but still above 25. −DI (29.0) is above +DI (19.2), with a bearish DI crossover on Nov 6. The trend is strong and bears are in control. [Strong Trend – Bearish]
- Volume: 4.19M, about average, with no capitulation spike. The Nov 4 surge reversed on persistent selling, so the rally looks like a failed breakout. Volume does not yet show an exhaustion low. [Neutral to Mildly Bearish]
DIVERGENCES & TRENDS
- No clear bullish divergence. Price is above its Oct 29–30 low (~$61.5) while RSI is at 40, higher than the ~25–30 readings at that low, so there is no divergence in either direction.
- Momentum is deteriorating across the board: RSI fell from 79 to 40, MACD went from +1.03 to -0.05, and CMF went from +0.15 to -0.22 in two sessions.
- Crossovers: EMA10 crossed below EMA20, MACD crossed below its signal line, and −DI crossed above +DI. All are bearish and recent.
- Long-term trend: price is below SMA50 ($71.03) and SMA200 ($81.04), and SMA50 is well below SMA200 (death cross already in place). The primary trend is down.
- Price is also below VWAP ($63.83), confirming sellers are in control intraday.
- The Nov 4–5 spike was a one-day gap up that has now been fully retraced, which is a classic failed breakout inside a larger downtrend.
CHART PATTERNS
- The chart most resembles a Bearish Pennant / Flag (continuation) pattern. A sharp drop from $70 to about $61.5 was followed by a consolidation base, and the Nov 4 spike failed against falling moving averages. Price now rolls over from the upper range.
- Alternatively, the Oct 29–Nov 3 base around $61.5–$62.5 may be forming a Bullish Double Bottom structure, but the retest has not happened yet and it would need a close above ~$66 to confirm. That is not supported by the current momentum readings.
- Pattern target: a break of the consolidation base at $61.5–$62.0 projects toward $59–$60. The base itself is the first support and the key invalidation for the bounce case.
POTENTIAL SCENARIOS
- Scenario 1: Bearish Retest of the Base — Price keeps sliding under the EMAs on distribution (CMF -0.22) and a bearish MACD/DI setup, retests the $61.5–$62.0 low, and may probe slightly below it. Trigger: close below the lower Bollinger Band (~$63.05) and the Nov 6 low. Target: $61.00–$61.80. Invalidation: daily close above $64.35 (EMA20) with RSI back above 50. (50% probability)
- Scenario 2: Neutral Range Chop — Price finds support near $62–$63 and trades sideways between that and the EMA cluster at $64.1–$64.3 as ADX fades. Trigger: hold of the lower band and a stalling CMF. Target: $62.50–$64.30. Invalidation: close below $61.50 or above $65.00. (28% probability)
- Scenario 3: Bullish Oversold Bounce — Price snaps back from the lower band toward the EMAs and VWAP, and possibly the $66 resistance, in a relief rally. Trigger: close above $64.35 with a MACD histogram turn. Target: $65.50–$66.50. Invalidation: loss of $62.00. (22% probability)
PRICE TARGETS
- Target Price: $62.00 (13-day)
- Expected Range: $58.90 to $66.00. Width is $7.10, about 11.2% of the current price, consistent with the 8–12% guidance for 14–21 days (13 days is just under this band, so the width sits slightly above the mid-range given the elevated ATR of $0.61).
- Key Levels: Support at $61.50, Resistance at $64.32
OVERALL BIAS
OVERALL BIAS: BEARISH - Price is below the 10 and 20 EMAs, the SMA50 and SMA200, and VWAP, with a fresh bearish MACD crossover, a −DI > +DI crossover with ADX at 28, and CMF at -0.224 showing heavy distribution. The Nov 4 spike failed and is likely to retest the $61.5–$62 base.
This is educational analysis and not financial advice.