MSFT 13-day bearish forecast — Nov 8, 2026
- Bias: Bearish
- Timeframe: 13 days (made Nov 8, 2026, target date Nov 20, 2026)
- Price at analysis: $530.72
- Price target: $522.00
- Expected range: $502.00 – $549.00
- Result: Pending — graded after the close on Nov 20, 2026
Get a free AI analysis of MSFT today
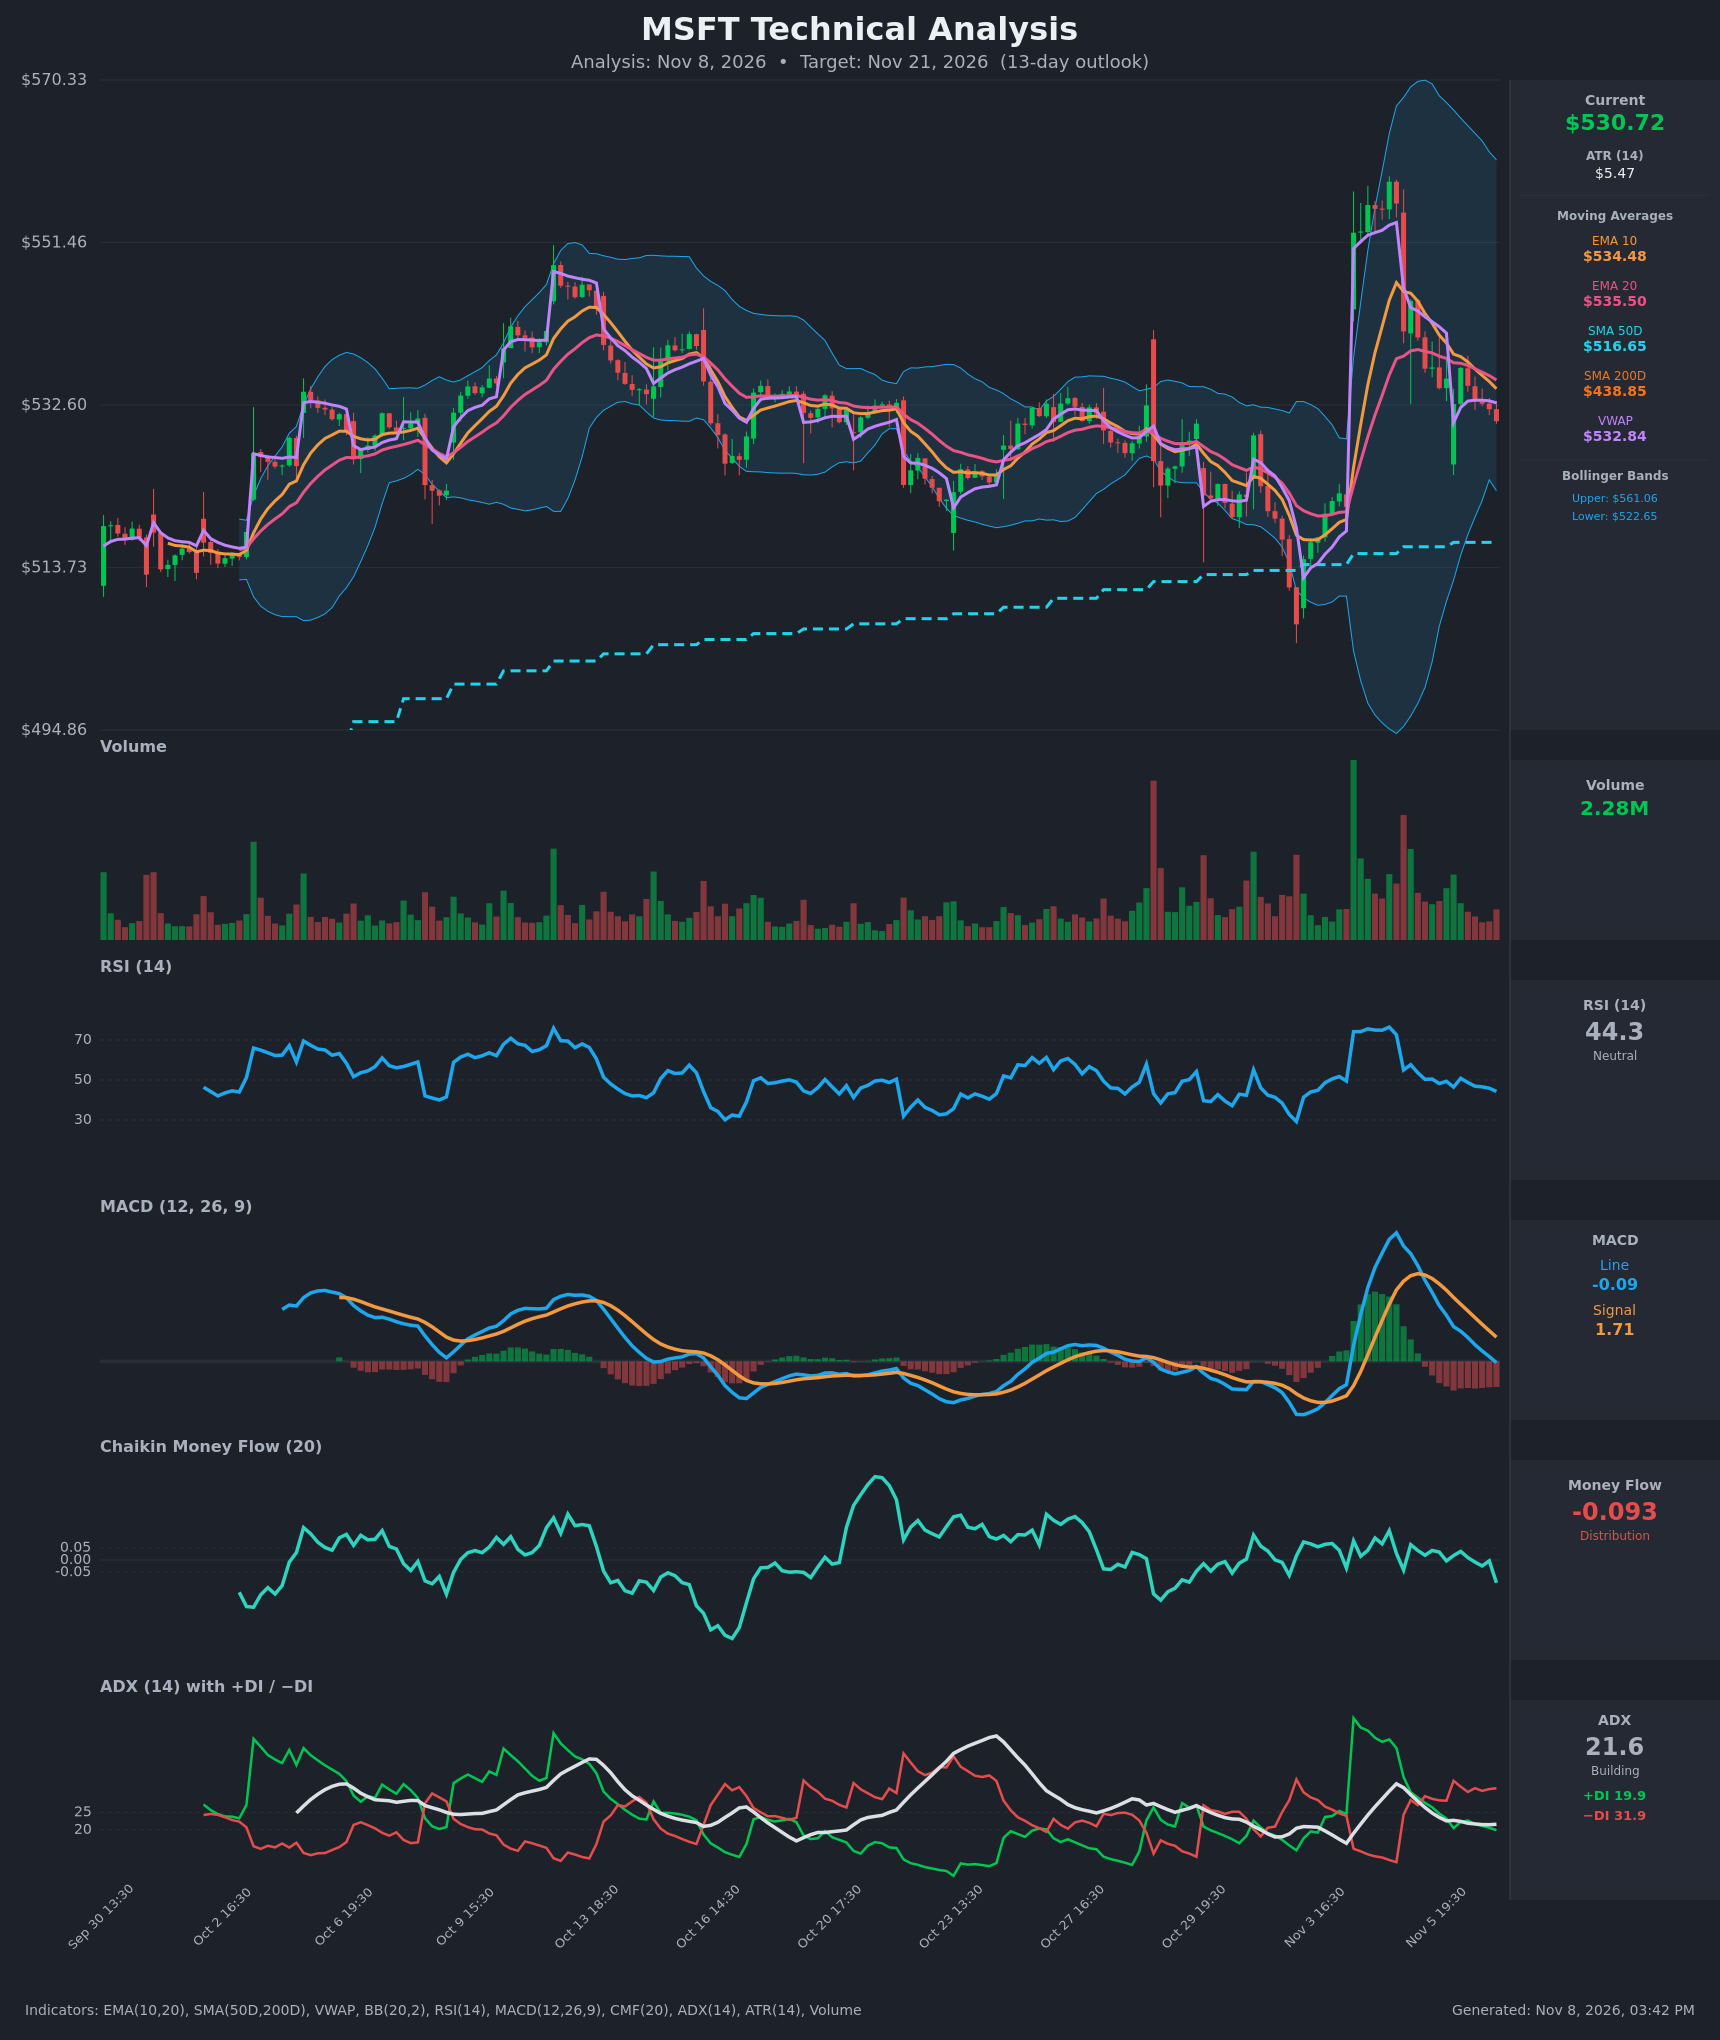
Analysis
TECHNICAL INDICATORS
- RSI (14): 44.31, down from 72.6 on Nov 4 and drifting below 50 for the last several bars. It is not oversold, and there is room to fall toward 30-35 before a bounce. Momentum is fading. [Bearish]
- 20 EMA: $535.50. Price at $530.72 is below both the EMA 20 and EMA 10 ($534.49). EMA10 crossed below EMA20 on Nov 6 (17:30), which turns the short-term averages into overhead resistance. [Bearish]
- MACD: Line -0.09 has crossed below the signal at 1.71, and the histogram is increasingly negative. The line is now below zero after peaking near 9 on Nov 4. This is a bearish crossover with momentum still deteriorating. [Bearish]
- Bollinger Bands (20): Upper $561.06, lower $522.65, middle band near $541.85. Price sits in the lower half of the bands, about $8 above the lower band. The bands are wide after the earnings-style gap on Nov 4. Price is trending toward the lower band, so a test of $522-523 is plausible. [Bearish]
- CMF (20): -0.093, below the -0.05 threshold and falling from slightly positive levels. This shows distribution and selling pressure on recent sessions. [Distribution]
- ADX (14): 21.6 with −DI (31.9) well above +DI (19.9). Trend strength is marginal, just above the 20 range-bound line. Direction is clearly bearish, with sellers in control. [Weak Trend, Bearish Direction]
- Volume: 2.28M on the latest bar, which is average to below average. The big volume spike came on the Nov 3-4 gap up, and the pullback since has had moderate volume. That is a mildly corrective profile, not panic selling. [Neutral to Mildly Bearish]
Other context: Price is below VWAP ($532.84). It remains well above SMA50D ($516.65) and SMA200D ($438.85), so the long-term uptrend is intact. There is no death cross.
DIVERGENCES & TRENDS
- There is no clear bullish divergence. RSI and MACD are making lower highs after the Nov 4 spike, and price is also fading, so the indicators confirm price.
- MACD completed a bearish crossover on Nov 6 (signal 1.71 vs line -0.09). The histogram is negative and expanding.
- EMA10 crossed below EMA20 on Nov 6 (17:30).
- The DI spread has widened to about 12 points in favor of −DI. ADX is flat near 21-22, so this is a drift lower, not a strong trend.
- CMF turned negative at -0.093, a deterioration from near zero.
- Price gapped up on Nov 3-4, then gave back most of the gains and filled the gap toward the $530 area. The prior consolidation zone was $525-$535.
- The long-term trend is bullish (price above SMA50D and SMA200D), so the pullback may find support at $522-$525, then $516 (SMA50D).
CHART PATTERNS
- The closest match is a Bearish Pennant / Flag or a post-gap pullback. A sharp spike up on Nov 3-4 has been followed by a lower-high, lower-low drift. This is a failed breakout, a spike that fully retraced.
- The price structure over the last month is a broad range / rectangle between roughly $520 and $550, with repeated rejections at the top. The Nov 4 spike failed to hold above $545.
- Measured move: a break below the $522-$525 range floor would target the SMA50D area near $516, then roughly $510. The range floor has held on multiple tests (Oct 29-30 low near $513).
- No strong reversal pattern has completed, so the pattern reading is modest. It suggests a drift lower inside a larger range.
POTENTIAL SCENARIOS
- Scenario 1: Bearish Drift to Range Support — Bearish momentum (MACD cross, −DI dominance, CMF distribution) pushes price toward the lower Bollinger Band and the rising SMA50D. Trigger: a close below $528 and then below $522.65. Target: $518-$522, with an extension to $516. Invalidation: a daily close above $536 (EMA20 and EMA10 reclaimed). (50% probability)
- Scenario 2: Neutral Range Chop — Price holds the $522-$536 zone while the indicators reset, with RSI hovering in the 40s. Trigger: support holds near $522-$525 and sellers fade. Target: $525-$535. Invalidation: a break of either side of the range on volume. (30% probability)
- Scenario 3: Bullish Rebound — Dip buyers defend the long-term uptrend, and price reclaims the EMAs and VWAP. Trigger: a close above $536 with a MACD re-cross and CMF back above 0. Target: $543-$548. Invalidation: a close back below $528. (20% probability)
PRICE TARGETS
For the 13-day timeframe, the target date is Nov 21. The range width should be about 8-12% of the current price. The Expected Range of $502.00 to $549.00 is $47.00 wide, which is 8.9% of $530.72. That is in line with the 14-21 day guidance and much wider than a 2-3 day range.
- Target Price: $522.00 (13 days)
- Expected Range: $502.00 to $549.00
- Key Levels: Support at $522.65 (lower Bollinger Band; SMA50D at $516.65 below it), Resistance at $535.50 (EMA 20)
OVERALL BIAS
OVERALL BIAS: BEARISH - MACD has crossed below its signal line, EMA10 has crossed below EMA20, −DI (31.9) dominates +DI (19.9), CMF shows distribution at -0.093, and price is below VWAP and the short EMAs. The long-term uptrend is intact above SMA50D and SMA200D, so the downside is likely a pullback toward $516-$522, not a collapse.
This is educational analysis and not financial advice.