NBIS 13-day bearish forecast — Nov 8, 2026
- Bias: Bearish
- Timeframe: 13 days (made Nov 8, 2026, target date Nov 20, 2026)
- Price at analysis: $129.43
- Price target: $124.00
- Expected range: $118.00 – $132.50
- Result: Pending — graded after the close on Nov 20, 2026
Get a free AI analysis of NBIS today
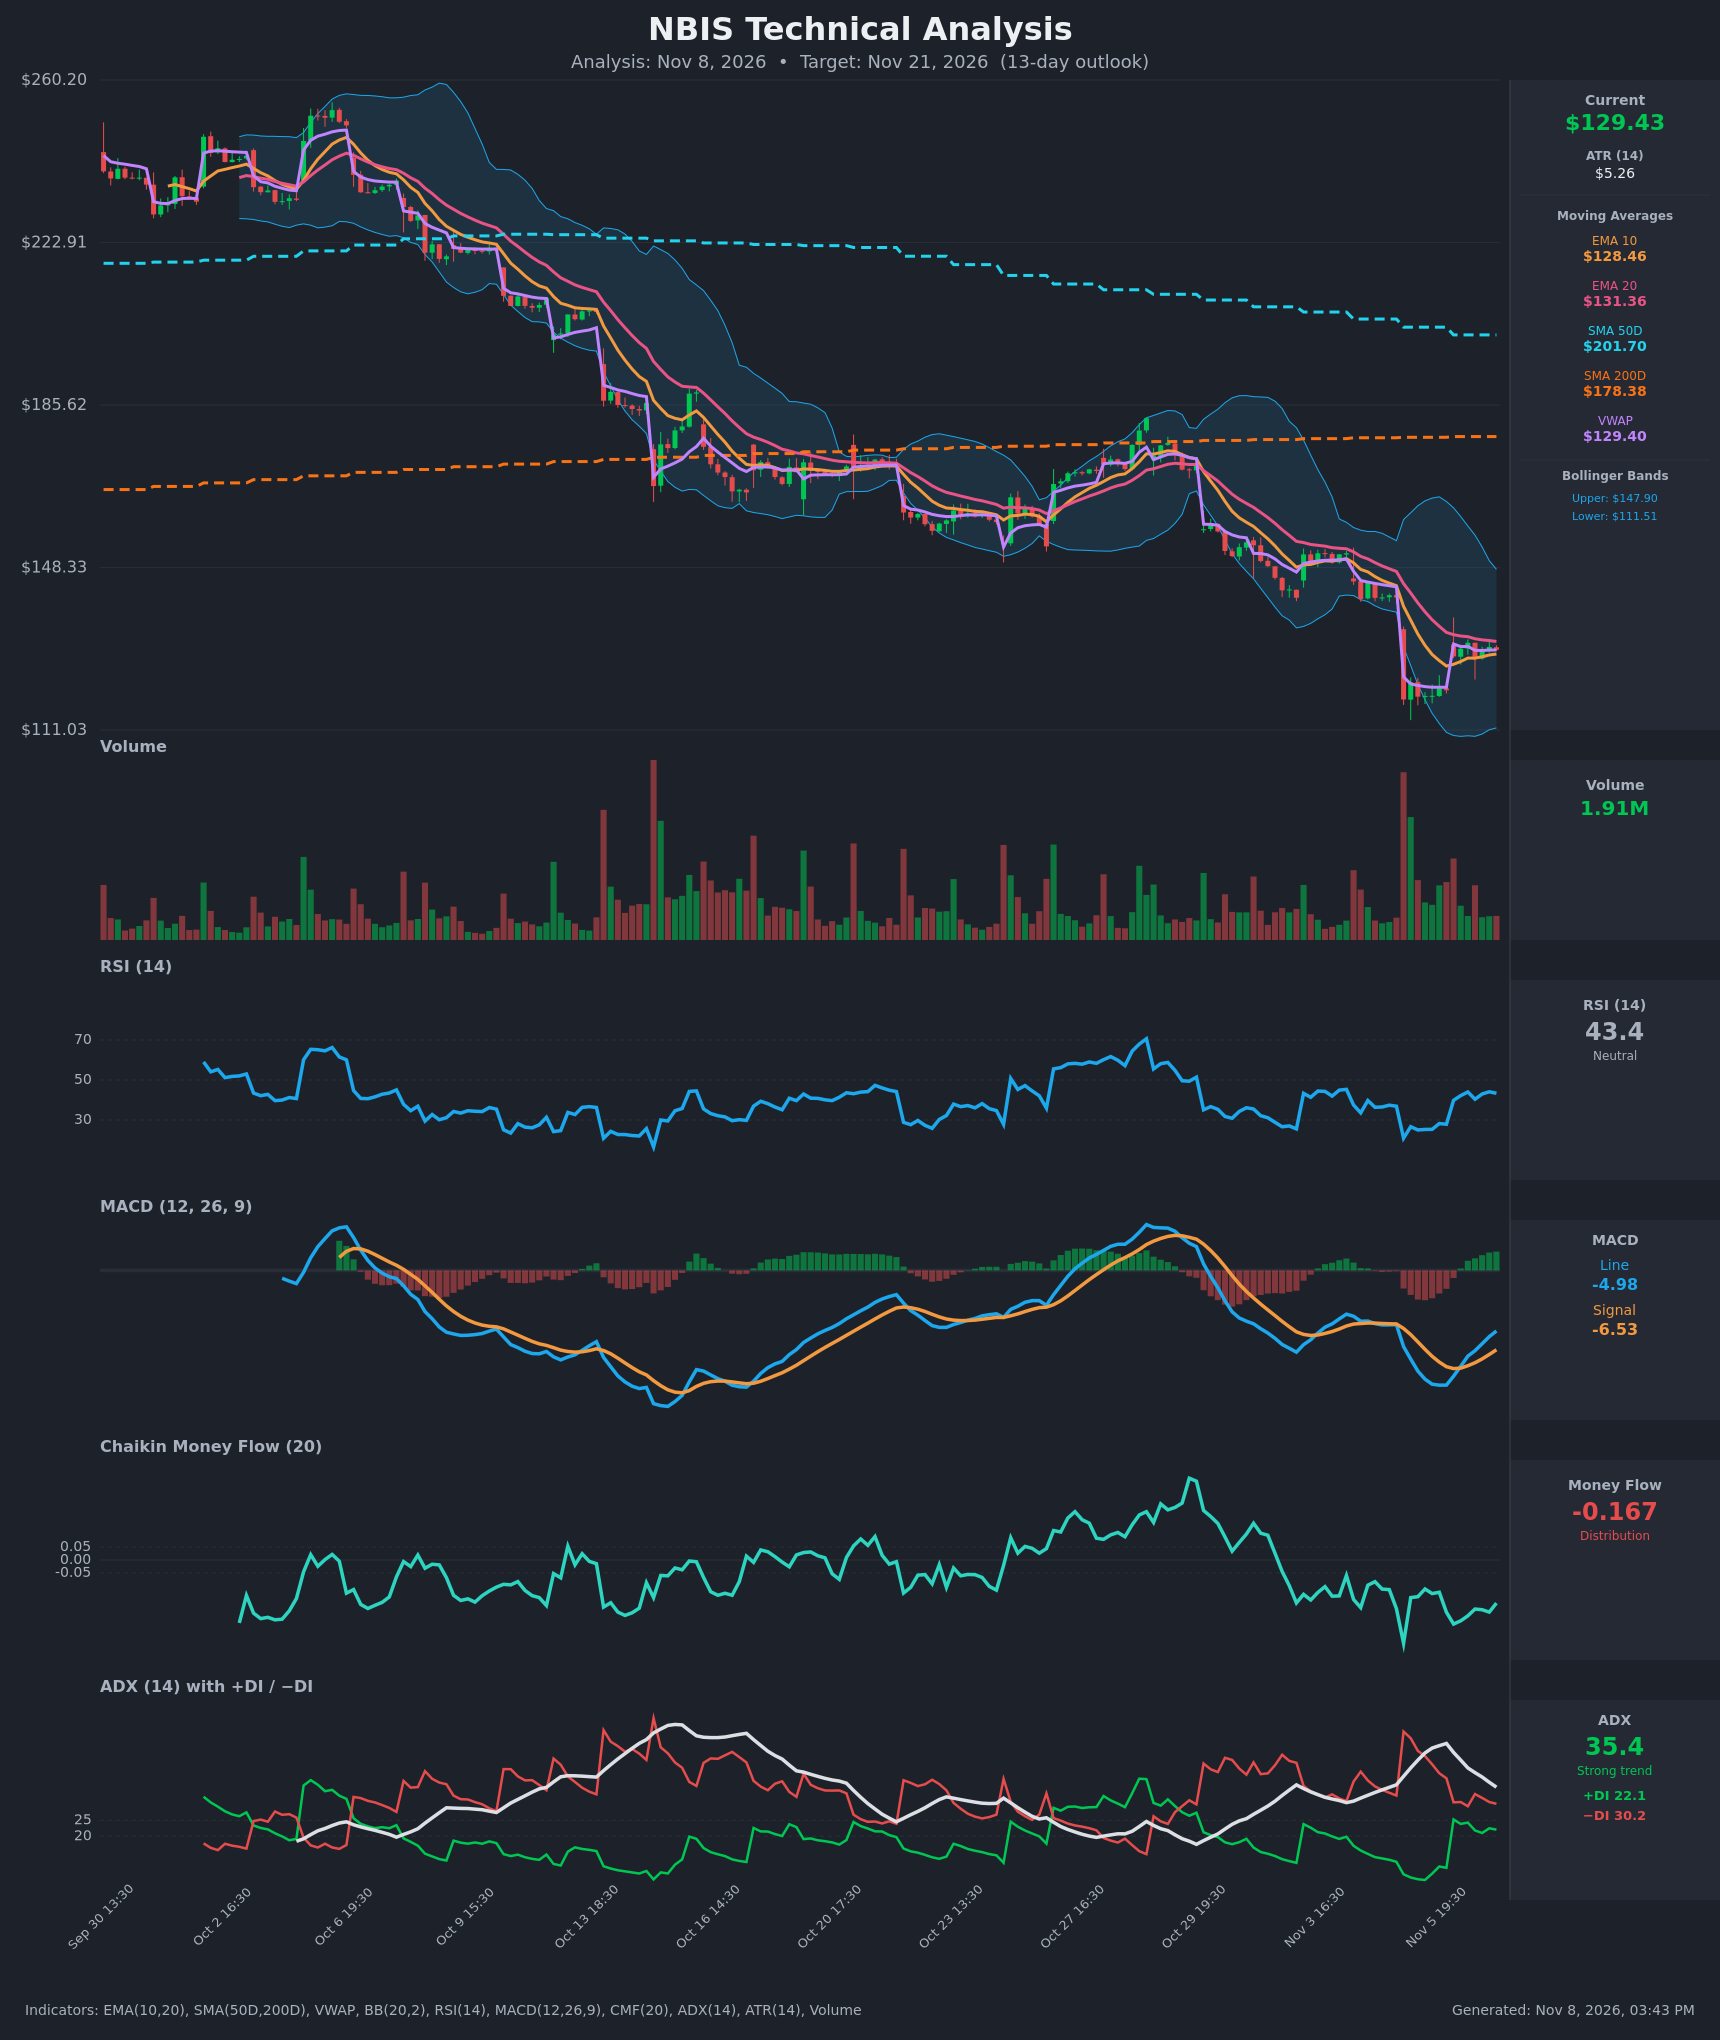
Analysis
TECHNICAL INDICATORS
- RSI (14): 43.35, recovering from deeply oversold readings (20.9 on Nov 5) but still below 50. Momentum is improving, though it has not crossed back into bullish territory. [Neutral]
- 20 EMA: $131.36, with price at $129.43 just below it, so it acts as overhead resistance. The EMA10 ($128.46) sits just under price. EMA10 is below EMA20, so the bearish alignment remains. [Bearish]
- MACD: Line -4.98 is above signal -6.53, a bullish crossover that occurred on Nov 6 around 15:30. The histogram is positive and rising, but both lines are far below zero. This is a relief bounce inside a larger downtrend, not a trend reversal. [Neutral]
- Bollinger Bands (20): Upper $147.90, lower $111.51, midline about $129.71. The bands are wide after the Nov 5 gap-down, and price has bounced from the lower band back to the midline. The midline is the immediate pivot. [Neutral]
- CMF (20): -0.167, well below -0.05, and has stayed negative since the Nov 3-5 selloff. Selling pressure is persistent and the bounce has not drawn accumulation. [Distribution]
- ADX (14): 35.4, a strong trend that is now fading from its 49 peak. −DI (30.2) is above +DI (22.1), so bears still control, though the gap has narrowed from 52.8 vs 8.1. [Strong Trend – Bearish]
- Volume: 1.91M, much lighter than the capitulation spike on Nov 5. The bounce is on modest volume, so buyers lack conviction. Price is hugging VWAP ($129.40), which is balanced. [Weak bounce / Bearish-leaning]
DIVERGENCES & TRENDS
- Long-term structure: Price is far below both the SMA50D ($201.70) and SMA200D ($178.38). The SMA50D is below the SMA200D after an earlier death cross, and both are declining or flat. This is a firm long-term downtrend.
- Bullish MACD divergence: MACD made a higher low than the earlier trough while price made new lows. This suggests selling momentum is exhausting and supports a relief bounce.
- CMF: CMF is still negative with no confirming improvement. Money flow is not backing the bounce.
- Trend: The EMA10 is below the EMA20 and the gap is narrowing (EMA10 $128.46 vs EMA20 $131.36). A bullish cross is possible if price pushes higher. The ADX is rolling over from its peak, which points to a pause or consolidation rather than an accelerating selloff.
- Lower highs: The sequence of lower highs and lower lows since early October is intact. The bounce so far has not broken that sequence.
CHART PATTERNS
- Bearish Flag / Pennant (continuation): The sharp drop from about $141 to $118 (the pole) is followed by a small, tight consolidation between $127 and $131. This resembles a bearish flag or pennant. A breakdown below about $127 would project toward $118 or lower. The measured move from the pole is larger, but I use the $118 area as a conservative target given prior support.
- Longer-term: The multi-week decline in a descending channel with lower highs resembles a descending trend structure. No bullish reversal pattern (inverted H&S, double bottom) has completed.
POTENTIAL SCENARIOS
- Scenario 1: Bearish Flag Breakdown — The bounce stalls at the EMA20 and the downtrend resumes. −DI stays on top and CMF stays in distribution. Trigger: close below $127.00 (the consolidation low and EMA10 area). Target: $124.00, then $118.00. Invalidation: daily close above $135.00. (50% probability)
- Scenario 2: Bullish Relief Rally — The MACD crossover and bullish divergence lead to a push through the EMA20, with price heading toward the upper half of the Bollinger Bands. Trigger: break and hold above $131.40 on rising volume. Target: $138.00-$140.00. Invalidation: loss of $127.00. (30% probability)
- Scenario 3: Neutral Consolidation — Price chops between $122 and $132 as the ADX continues to fade. Trigger: failure to break either $131.40 or $125.00 for several sessions. Target: $127.00-$130.00. Invalidation: close outside $120-$134. (20% probability)
PRICE TARGETS
- Target Price: $124.00 (13-day outlook, about -4.2% from $129.43)
- Expected Range: $118.00 to $132.50 (width $14.50, about 11.2% of current price, appropriate for 13 days)
- Key Levels: Support at $118.00, Resistance at $131.36
OVERALL BIAS
OVERALL BIAS: BEARISH - Price is in a strong downtrend, below the SMA50D and SMA200D with −DI above +DI and CMF in distribution. The bounce looks like a low-volume bearish flag under the EMA20 resistance. The bullish MACD cross and fading ADX temper conviction, but they are not enough to call a reversal.
This is educational analysis and not financial advice.