NVDA 13-day bearish forecast — Nov 8, 2026
- Bias: Bearish
- Timeframe: 13 days (made Nov 8, 2026, target date Nov 20, 2026)
- Price at analysis: $186.68
- Price target: $181.00
- Expected range: $171.00 – $192.00
- Result: Pending — graded after the close on Nov 20, 2026
Get a free AI analysis of NVDA today
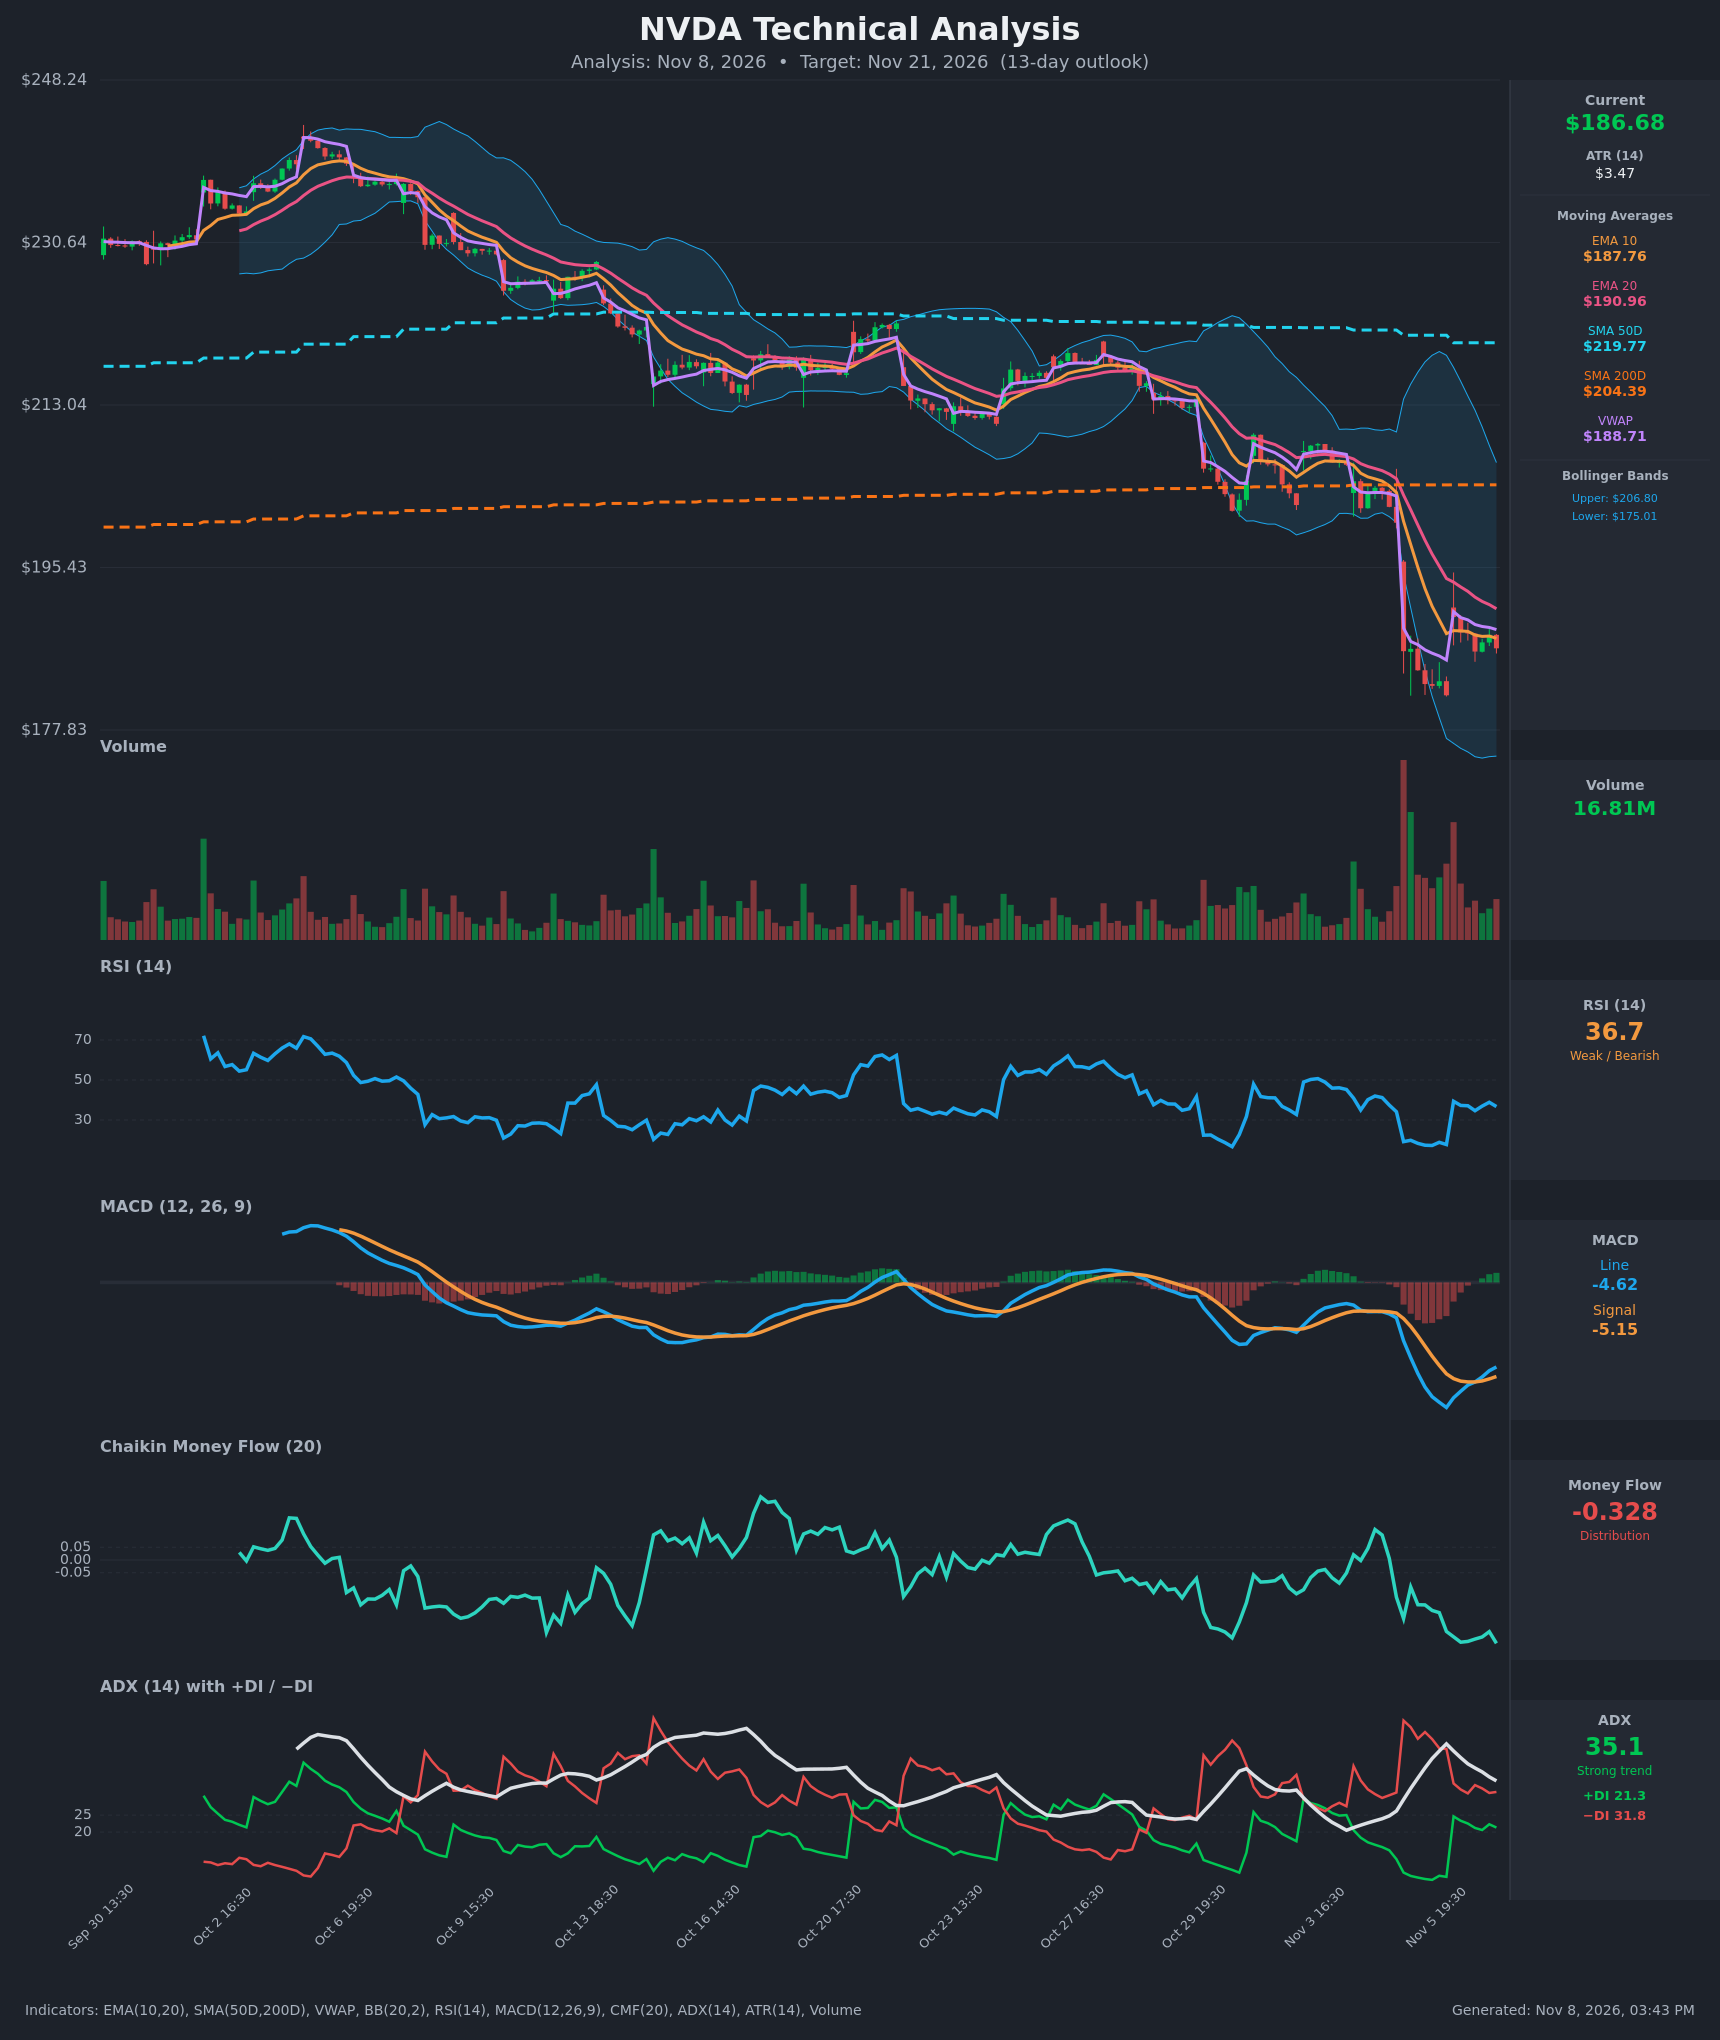
Analysis
TECHNICAL INDICATORS
- RSI (14): 36.72, bouncing from deeply oversold (17.3 on Nov 5) but still below 40 and capped under 50. This is a relief bounce, not a momentum reversal. [Bearish]
- 20 EMA: $190.96, with price at $186.68 below it. EMA10 ($187.76) is also below EMA20, and both are sloping down. The EMA20 and VWAP ($188.71) form overhead resistance. [Bearish]
- MACD: Line -4.62 is above signal -5.15, with a small positive histogram (about +0.52). The bullish crossover happened deep below zero after a sharp drop, so it is a weak, early-stage signal that only reflects the decline slowing. [Neutral]
- Bollinger Bands (20): Upper $206.80, lower $175.01, middle about $190.9. The bands are widened by the Nov 5 gap-down. Price sits in the lower half and has pulled back from the lower band, with the middle band (about $191) as the first test. [Bearish]
- CMF (20): -0.328, far below the -0.05 threshold and near the cycle low. This is heavy, persistent distribution, and the recent bounce shows no accumulation. [Distribution]
- ADX (14): 35.1 with −DI 31.8 above +DI 21.3. ADX has eased from its 46 peak but remains above 25, so the trend is still strong. Bears hold control, though the DI gap has narrowed from the gap-down. [Strong Trend – Bearish]
- Volume: 16.81M, well below the capitulation spike on Nov 5. The bounce is on lighter volume, which suggests a low-conviction rebound within a downtrend. [Bearish/Fading selling pressure]
Price is also below both the SMA50D ($219.77) and SMA200D ($204.39). The SMA50 is still above the SMA200, so there is no death cross yet, but the gap is closing.
DIVERGENCES & TRENDS
- Short-term MACD/RSI divergence: RSI and MACD have turned up from extreme lows while price made a flat to slightly lower low (about $181.6 vs. $182.6). That is a mild bullish momentum divergence, but it is only a relief signal.
- CMF confirms the downtrend: it keeps making lower lows (-0.146 → -0.328) as price consolidates, which is bearish.
- MACD crossover: a bullish cross occurred around Nov 6 18:30, still deeply negative, so it is lower-quality.
- DI and ADX: −DI has stayed above +DI since the gap. +DI has recovered from 6 to 21 but has not crossed.
- Moving averages: EMA10 has been below EMA20 since the break. Price rejected near the EMA10/VWAP cluster at $188-$191.
- Trend structure: a series of lower highs and lower lows, with the price now stabilizing in a tight $181.6-$190 range after the gap.
CHART PATTERNS
- Bearish Flag / Bearish Pennant (continuation): after the sharp drop from about $200 to $182, price is consolidating in a narrow, slightly rising range between $181.6 and about $190. A breakdown below $181.6 would project a measured move of roughly 18 points toward $164, with the lower Bollinger Band ($175) as the first magnet.
- Bearish Rising Wedge (minor): the weak bounce with lower volume and rising lows resembles a small rising wedge. A rollover would confirm bearish continuation.
- Invalidation: a close above the EMA20/gap-fill area ($191-$195) would negate the flag and shift the bias toward a relief rally.
POTENTIAL SCENARIOS
- Scenario 1: Bearish Flag Breakdown — the relief bounce stalls at the EMA20/VWAP cluster and price rolls over to break the consolidation low, with distribution (CMF -0.33) and −DI dominance extending the trend. Trigger: close below $181.60. Target: $175-$178 (lower Bollinger Band), extended target $171. Invalidation: daily close above $191.50. (50% probability)
- Scenario 2: Bullish Relief Rally — oversold RSI and the MACD cross fuel a mean-reversion bounce back to the declining moving averages. Trigger: close above $191 on rising volume. Target: $195-$198 (gap-fill zone and mid-Bollinger resistance). Invalidation: close back below $184. (32% probability)
- Scenario 3: Neutral Chop — price oscillates inside the $181.6-$190 range as selling exhausts but buyers fail to reclaim the EMAs. Trigger: ADX continues to fade and volume dries up. Target: $184-$189. Invalidation: close outside the $181.6-$191 range. (18% probability)
PRICE TARGETS
Range check: $192.00 − $171.00 = $21.00, which is 11.2% of the $186.68 current price. This is within the 8-12% guidance for 14-21 days and wider than a 2-3 day range.
- Target Price: $181.00 (13-day outlook)
- Expected Range: $171.00 to $192.00
- Key Levels: Support at $181.60, Resistance at $190.96
OVERALL BIAS
OVERALL BIAS: BEARISH - Price is below all key moving averages in a strong −DI-led trend (ADX 35), with severe distribution (CMF -0.33) and a low-volume bounce forming a bear flag under EMA20/VWAP resistance. The oversold RSI and the weak MACD cross argue for a possible relief bounce, but the weight of evidence favors continuation lower toward the lower Bollinger Band.
This is educational analysis and not financial advice.