ORCL 13-day bearish forecast — Nov 8, 2026
- Bias: Bearish
- Timeframe: 13 days (made Nov 8, 2026, target date Nov 20, 2026)
- Price at analysis: $116.05
- Price target: $112.80
- Expected range: $107.50 – $118.00
- Result: Pending — graded after the close on Nov 20, 2026
Get a free AI analysis of ORCL today
Analysis
TECHNICAL INDICATORS
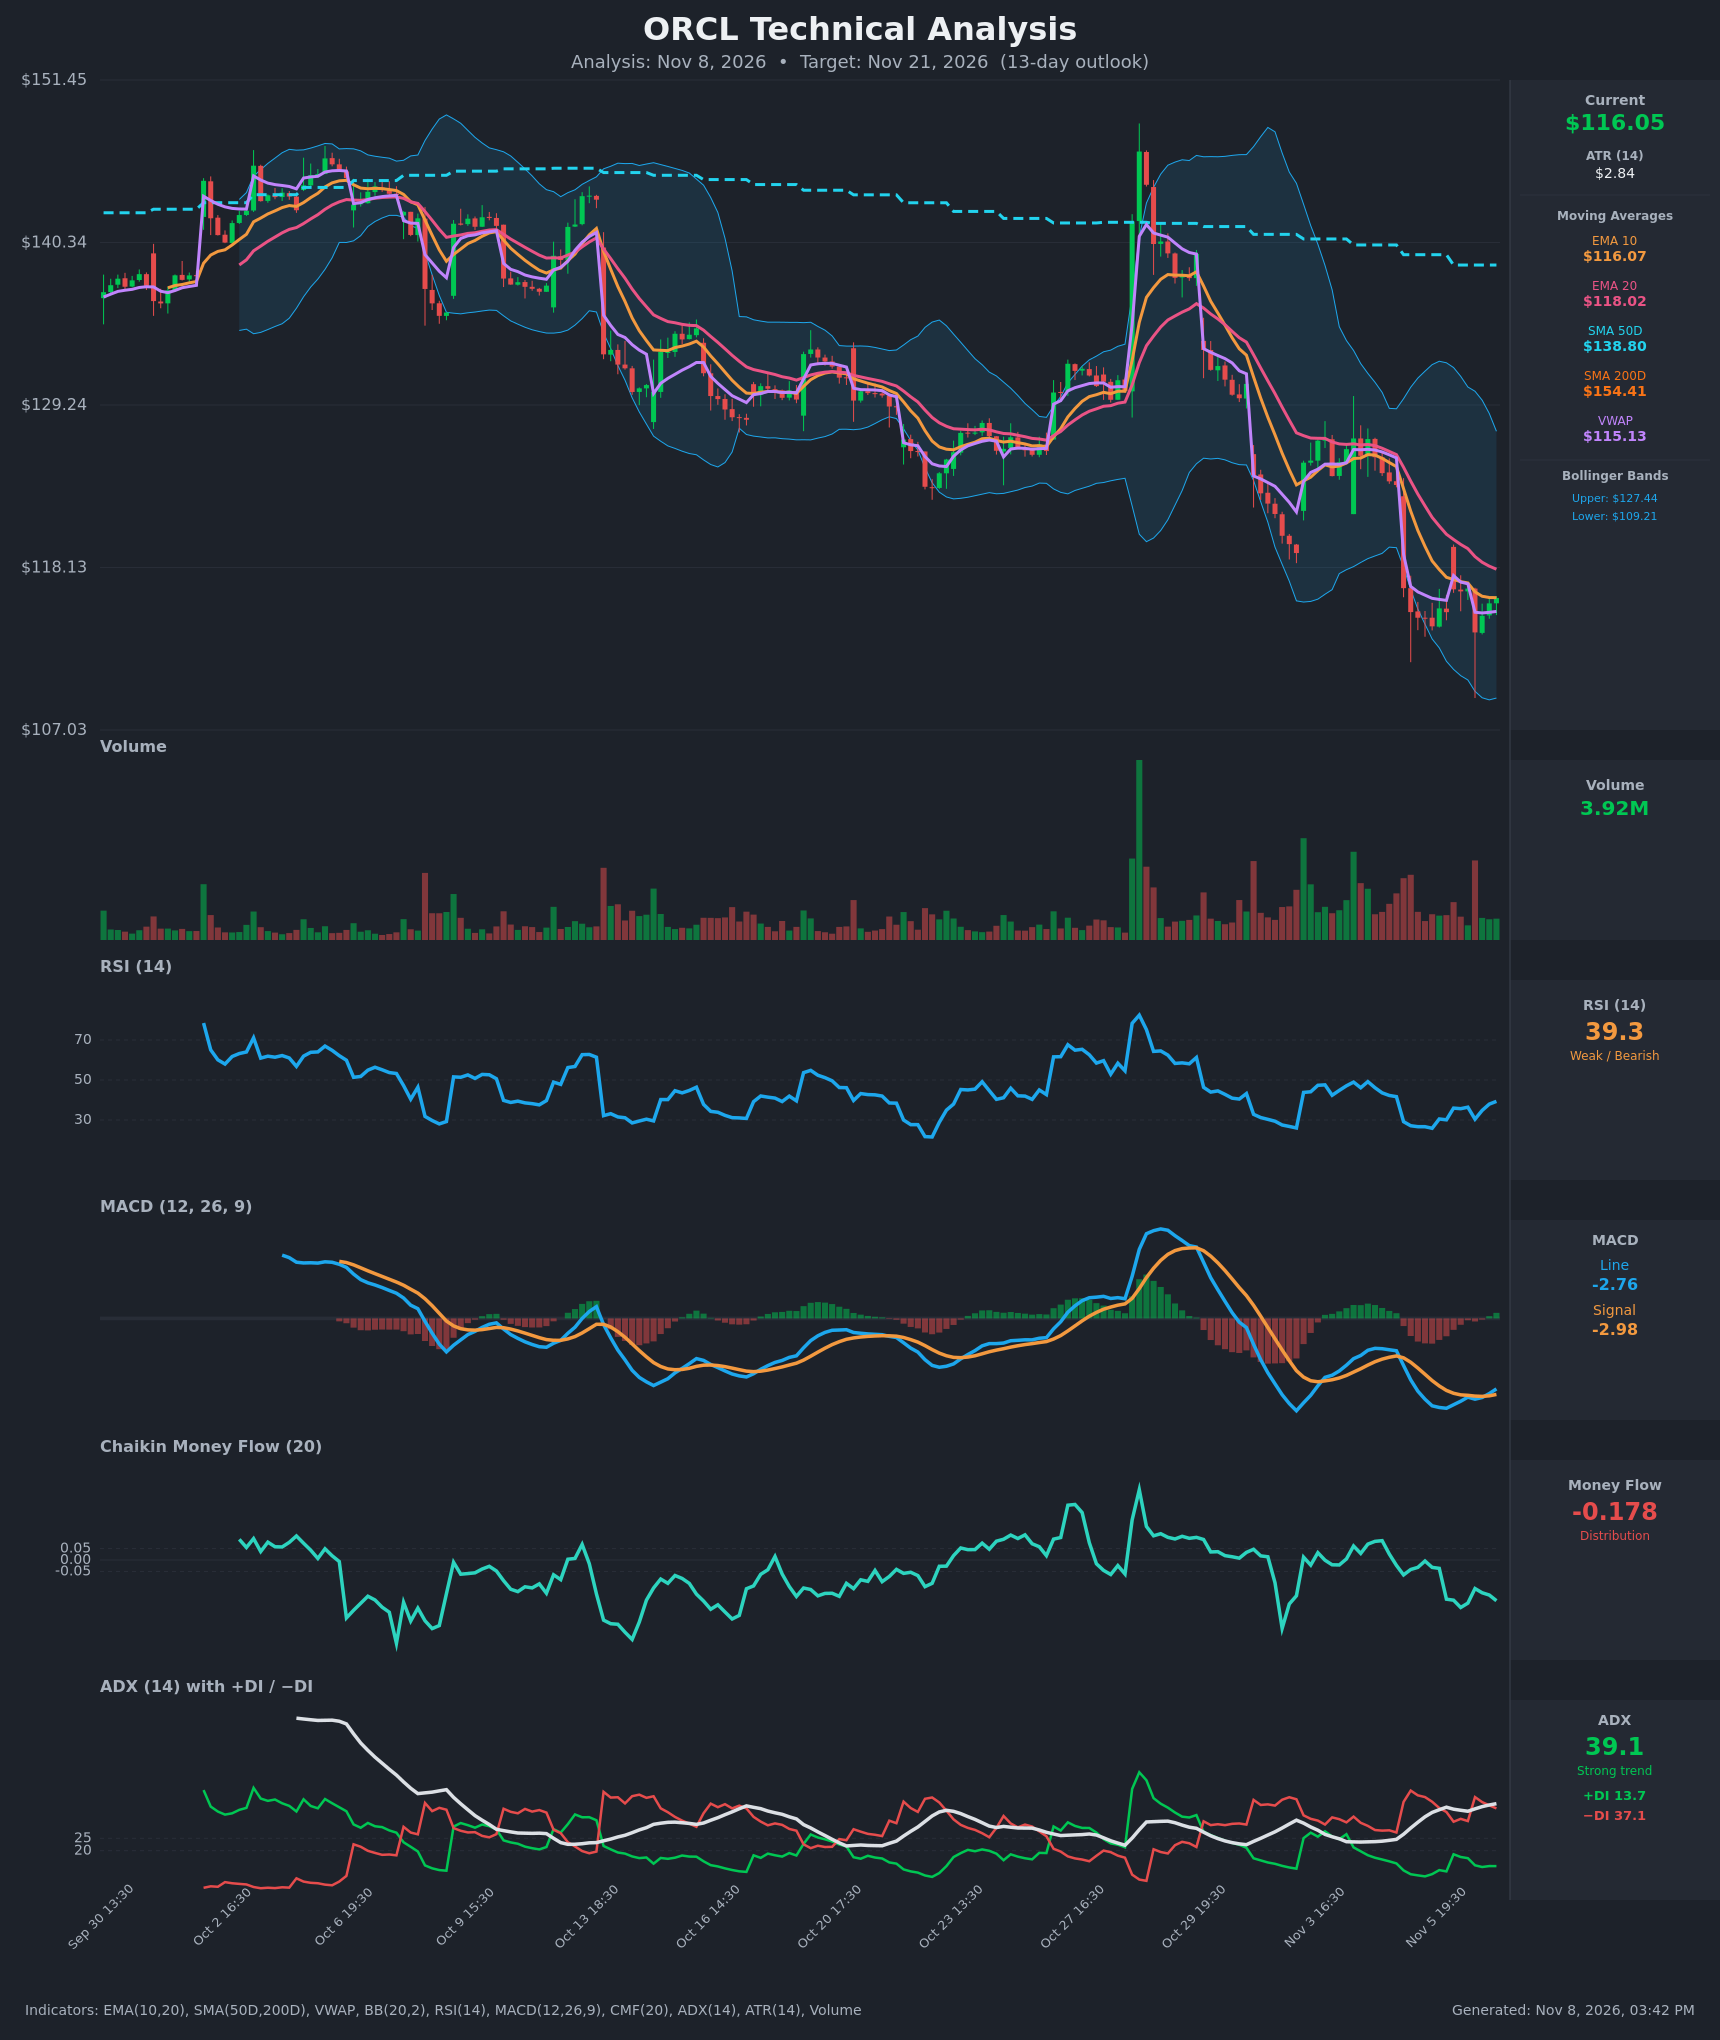
- RSI (14): 39.32, recovering from deeply oversold readings (25.9 to 26.7 on Nov 5) and rising for several bars. It is still below 40 and has not reclaimed 50, so this reads as a relief bounce inside a downtrend. [Bearish]
- 20 EMA: $118.02, about 1.7% above price and still sloping down. EMA10 ($116.07) sits below EMA20, and price is pinned right at EMA10. The EMA20 is the first overhead resistance. [Bearish]
- MACD: Line -2.76 is just above Signal -2.98, so the histogram is slightly positive and a small bullish crossover has formed. Both lines are deeply negative, so it is only a weak momentum bounce from a depressed level. [Neutral]
- Bollinger Bands (20): Upper $127.44, lower $109.21, so price is in the lower half of the bands, near the lower-to-mid range after tagging the lower band on Nov 5-6. The bands are wide after the volatile spike, and the middle band (about $118) is a resistance target. [Bearish]
- CMF (20): -0.178, well below -0.05 and sustained negative since the Nov 5 selloff. This shows persistent distribution with no sign of accumulation. [Distribution]
- ADX (14): 39.1 and rising, with −DI (37.1) far above +DI (13.7). This is a strong, established downtrend, and the DI gap has widened rather than closed. [Strong Trend – Bearish]
- Volume: 3.92M is moderate, well below the heavy-volume selling spike on Nov 5. The recent bounce bars are on light, mixed volume, so the rally lacks conviction. [Neutral-to-Bearish]
Other trend context:
- VWAP: $115.13, just below price. Price is marginally above it, which is a minor short-term support.
- SMA50D and SMA200D: $138.80 and $154.41. Price is far below both, and the SMA50D is below the SMA200D, so the death cross is already in place. [Bearish]
DIVERGENCES & TRENDS
- No clear bullish divergence: RSI made a higher low (about 30 to 39) while price made roughly equal lows (about $113.7-$114.7). That is only a mild positive momentum improvement and is not a confirmed reversal signal.
- MACD: The recent MACD crossover is small and happened far below zero, which has low reliability in a strong downtrend. A failure to extend the histogram would resume the bearish bias.
- ADX/DI: −DI has dominated for the whole recent window, and ADX is climbing to 39. This is the textbook profile of a mature, strong downtrend, where bounces tend to be sold.
- Moving averages: Price is below the EMA10, EMA20, SMA50D and SMA200D, all in bearish order (EMA10 < EMA20 < SMA50 < SMA200). The last few bars show a series of lower highs, from $123.77 to $116.7 to $116.5.
- CMF: It deteriorated from -0.004 to -0.178 as price stalled, which confirms ongoing distribution.
CHART PATTERNS
- Bearish flag / pennant (continuation): After the sharp drop on Nov 5 (about $123.8 to about $114.7), price has consolidated in a tight $113.7-$116.7 range with lower highs. This matches the Bearish Flag/Pennant in the reference diagram. A break below about $113.70 would project a measured move of roughly $8-9 (the pole height), pointing toward $105-107. That is beyond the 13-day base case, so my target is more conservative.
- Broader context: The larger structure is a persistent descending channel of lower highs and lower lows since early October, with a failed spike rally in late October at the $145 area. That rally was fully retraced, which is bearish.
- Invalidation of the pattern: A close above about $118-$119 (EMA20 and the mid-Bollinger Band) would negate the flag and suggest a relief rally toward $121-$124.
POTENTIAL SCENARIOS
- Scenario 1: Bearish Flag Breakdown — Price fails to hold the $113.70-$114 consolidation floor and resumes the downtrend, with the strong ADX and −DI dominance and distribution in CMF all supporting this. Trigger: close below $113.70 on rising volume. Target: $109-$110 (lower Bollinger Band and Nov 5-6 wick lows), with an extension to $107 possible. Invalidation: daily close above $118.00. (55% probability)
- Scenario 2: Bullish Relief Bounce — The oversold RSI and small MACD bullish crossover fuel a mean-reversion bounce toward the EMA20 and mid-band, but the bounce stalls under the declining averages. Trigger: break above $116.70 and then $118. Target: $118-$121. Invalidation: rejection at $118 followed by a close below $114. (30% probability)
- Scenario 3: Neutral Range Consolidation — Price chops inside $113.70-$117 as momentum indicators reset. Trigger: failure to break either side of the flag with ADX flattening. Target: $114-$117. Invalidation: a decisive close outside $113.70-$118. (15% probability)
PRICE TARGETS
- Target Price: $112.80 (13-day horizon, about -2.8% from $116.05)
- Expected Range: $107.50 to $118.00 (width $10.50, about 9.0% of current price, consistent with the 13-day horizon)
- Key Levels: Support at $109.21 (lower Bollinger Band / recent wick lows), Resistance at $118.02 (EMA20 / mid-band)
Self-check: the width is 9.0%, which falls between the 7-10 day guidance (4-8%) and the 14-21 day guidance (8-12%), and is appropriate for 13 days. It is also much wider than a 2-3 day range. The target is below the current price, which is consistent with a bearish bias.
OVERALL BIAS
OVERALL BIAS: BEARISH - ADX at 39 with −DI far above +DI, price below every key moving average (with a death cross already in place), sustained CMF distribution, and a bearish flag consolidation after a high-volume breakdown all outweigh the weak oversold bounce and marginal MACD crossover.
This is educational analysis and not financial advice.